
Page 31 - S44 Compendium
P. 31
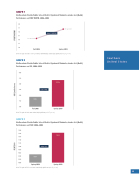
GRAPH 1
Northeastern Florida Public School District System 44 Students, Grades 6–8 (N=48) Performance on FORF WCPM, 2008–2009
80 75 70 65 60 55 50
Gain: 11 WCPM
73 WCPM
Spring 2009
62 WCPM
Fall 2008
Note. The gain in words correct per minute (WCPM) was statistically signi cant (t=3.27, p=.00).
GRAPH 2
Northeastern Florida Public School District System 44 Students, Grades 6–8 (N=52) Performance on SRI, 2008–2009
Southern United States
400 350 300 250 200 150 100
Fall 2008
Spring 2009
Note. The gain in Lexile was statistically signi cant (t=6.37, p=.00).
GRAPH 3
Northeastern Florida Public School District System 44 Students, Grades 6–8 (N=59) Performance on FCAT, 2008–2009
1200 1180 1160 1140 1120 1100 1080 1060 1040 1020 1000
Spring 2008
Spring 2009
Note. The gain in DSS scores was statistically signi cant (t=3.61, p=.00).
Gain: 147L
333L
186L
1182
Gain: 131
1051
29
FCAT DSS SRI Lexile Score FORF WCPM
