
Page 29 - S44 Compendium
P. 29
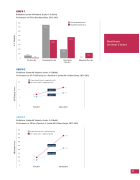
GRAPH 1
Bethlehem System 44 Students, Grades 3–5 (N=68) Performance on SPI by Decoding Status, 2011–2012
80% 70% 60% 50% 40% 30% 20% 10%
0
GRAPH 2
First SPI Administration Final SPI Administration
75%
19%
47%
40%
6%
1%
Pre-Decoder
Beginning Decoder
Developing Decoder
Advancing Decoder
12%
0%
Bethlehem System 44 Students, Grades 3–5 (N=68)
Performance on SPI Total Fluency as a Function of System 44 Software Usage, 2011–2012
Fewer than 60 topics completed (n=41) 60 or more topics completed (n=27)
20
15
5
0
GRAPH 3
8.9 5.8
Fall 2011
Gain: 8.8 Gain: 5.1
17.7 10.9
Spring 2012
Bethlehem System 44 Students, Grades 3–5 (N=68)
Performance on SRI as a Function of System 44 Software Usage, 2011–2012
450 400 350 300 250 200 150 100
50 0
Fewer than 60 topics completed (n=41) 60 or more topics completed (n=27)
Gain: 283L
375L
234L
Gain: 169L
Northern United States
92L 65L
Fall 2011
Spring 2012
27
SRI Lexile Score SPI Fluency Score % of Students
