
Page 39 - S44 Compendium
P. 39
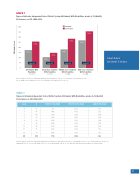
GRAPH 1
Cypress-Fairbanks Independent School District System 44 Students With Disabilities, Grades 4–12 (N=459) Performance on SRI, 2009–2010
400 350 300 250 200 150 100
50 0
Spring 2010
173L
Fall 2009
356L
283L
256L
269L
180L
148L
107L
Gain: 83L
Gain: 41L
Gain: 103L
Gain: 87L
Southern United States
All Students With Disabilities (N=459)
Elementary Students With Disabilities (n=146)
Middle School Students With Disabilities (n=209)
High School Students With Disabilities (n=104)
Note. The gains in Lexile were statistically signi cant for all students (t=11.46, p=.00), elementary school students (t=4.29, p=.00), middle school students (t=9.18, p=.00), and high school students (t=6.04, p=.00).
TABLE 1
Cypress-Fairbanks Independent School District System 44 Students With Disabilities, Grades 4–12 (N=459) Performance on SRI, 2009–2010
Grade
N
PRETEST SRI LEXILE
POSTTEST SRI LEXILE
GAIN IN SRI LEXILE
4
90
70L
120L
50L
5
56
147L
170L
23L
6
84
125L
233L
108L
7
71
181L
287L
106L
8
54
250L
373L
123L
9
41
238L
360L
121L
10
38
303L
408L
105L
11
15
280L
320L
39L
12
10
246L
277L
31L
All
459
173L
256L
83L
Note. The gains in Lexile were statistically signi cant for all students in fourth grade (t=3.82, p=.00), sixth grade (t=4.98, p=.00), seventh grade (t=6.44, p=.00), eighth grade (t=5.35, p=.00), ninth grade (t=4.11, p=.00), and tenth grade (t=4.94, p=.00). SRI Lexile gains have been rounded to the nearest integer.
37
SRI Lexile Score
