
Page 41 - S44 Compendium
P. 41
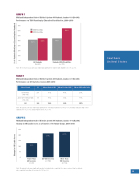
GRAPH 1
Midland Independent School District System 44 Students, Grades 4–9 (N=346) Performance on TAKS Reading by Education Classi cation, 2009–2010
70% 60% 50% 40% 30% 20% 10%
0%
All Students
Students With Disabilities
2009 Pass Rate 2010 Pass Rate
64%
44%
44%
42%
(N=346)
Note. The increase in pass rates was statistically signi cant for students with disabilities (t=3.36, p=.00).
TABLE 1
Midland Independent School District System 44 Students, Grades 4–9 (N=346) Performance on SRI by School Level, 2009–2010
Note. The gain in Lexile was statistically signi cant for elementary students (t=21.87, p=.00), freshman and junior high school students (t=9.10, p=.00), and all students (t=23.71, p=.00).
GRAPH 2
Midland Independent School District System 44 Students, Grades 4–9 (N=346) Change in SRI Lexile Score as a Function of Software Usage, 2009–2010
(n=116)
School Level
N
Mean Pretest SRI
Mean Posttest SRI
Mean SRI Lexile Gain
Elementary (4th–6th)
291
191L
401L
210L
Junior & Freshman High (7th–9th)
55
155L
352L
197L
All
346
186L
393L
207L
250 200 150 100
50 0
Fewer Than 80 Sessions (n=48)
80–100 Sessions
(n=160)
More Than 100 Sessions (n=129)
Southern United States
216L
229L
127L
Note. The gain in Lexile was signi cantly greater for students who completed 80 or more sessions than for students who completed fewer than 80 sessions (t=7.41, p=.00).
39
Change in SRI Lexile Score % of Students Meeting or Exceeding the Standard
