
Page 45 - S44 Compendium
P. 45
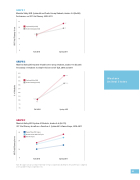
GRAPH 1
Murrieta Valley USD System 44 and Control Group Students, Grades 4–8 (N=293) Performance on SPI Total Fluency, 2010–2011
25 20 15 10
5 0
GRAPH 2
System 44 (n=147) Control Group (n=146)
23 19
Spring 2011
System 44 (n=140) Control Group (n=147)
32%
14
13
Fall 2010
Murrieta Valley USD System 44 and Control Group Students, Grades 4–8 (N=287) Percentage of Students Scoring Pro cient on CST ELA, 2010 and 2011
45% 40% 35% 30% 25% 20% 15% 10%
5% 0%
GRAPH 3
41%
Western United States
12% 11%
Fall 2010
Spring 2011
Murrieta Valley USD System 44 Students, Grades 4–8 (N=172)
SPI Total Fluency Growth as a Function of System 44 Software Usage, 2010–2011
30 Fewer Than 100 Topics Between 100 and 159 Topics
20
10
0
All 160 Topics
Fall 2010
Spring 2011
Note. The sample sizes are as follows: Fewer Than 100 Topics Completed (n=43); Between 100 and 159 Topics Completed (n=37); and All 160 Topics Completed (n=92).
43
SPI Total Fluency Score % of Students SPI Total Fluency Score
