
Page 47 - S44 Compendium
P. 47
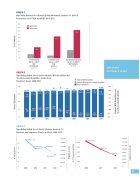
GRAPH 1
Napa Valley Uni ed School District System 44 Students, Grades 3–11 (N=517) Performance on CST ELA and CELDT, 2011–2012
50% 45% 40% 35% 30% 25% 20% 15% 10%
5% 0%
GRAPH 2
Pro cient and Above on CST ELA
All Students (N=517)
Pro cient and Above on CST ELA Grade 4 (n=142)
Early Advanced and Above on CELDT All Students (N=444)
Spring 2011 Spring 2012
6%
16%
4%
32%
12%
41%
Western United States
Napa Valley Uni ed School District Students With Disabilities and Speci c Learning Disabilities, Grades K–12
Students With Disabilities
Students With Speci c Learning Disabilities District Enrollment
18,078
Enrollment Trends, 2000–2011
20K
15K
10K
5K
0K
16,414
2,200 2,000 1,800 1,600 1,400 1,200 1,000 800 600
2,119
1,164
2,095
828
2,084
766
2,047
739
2,020
728
1,760
907
1,839
966
1,913
1,037
2,017
1,086
2,126
953
1,971
730
1,910
695
GRAPH 3
2001
2003
2005
2007
2009
2011
Napa Valley Uni ed School District Students, Grades K–12 Expulsion and Suspension Counts and Costs, 2006–2012
$342,000
$224,000
2010
$360,000
$300,000
$260,000
$200,000
$160,000
$100,000
$60,000 $00
$146,430
$160,000 $140,000 $120,000 $100,000 $80,000 $60,000 $40,000 $20,000 50
50 40 30 20 10
0
$241,900
5,000 4,000 3,000 2,000 1,000
$99,120
$62,580
2009
2011
$153,400
2012
2010
2011
2012
45
# of Expulsions
District Enrollment
% of Students
Expulsion Costs
# of Suspensions Days
Suspensions Costs
Students With Disabilities and Speci c Learning Disabilities
