
Page 53 - S44 Compendium
P. 53
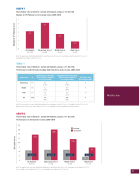
GRAPH 1
Three Public School Districts’ System 44 Students, Grades 3–11 (N=170) Change in SPI Fluency Score by Grade Level, 2009–2010
7 6 5 4 3 2 1 0
All Students
(N=170)
Elementary School
(n=60)
Middle School
(n=86)
High School
(n=24)
6.1
4.1
3.5
1.7
Note. The gains were statistically signi cant for overall Fluency (t=8.20, p=.00), elementary school Fluency (t=7.19, p=.00), and middle school Fluency (t=4.83, p=.00).
TABLE 1
Three Public School Districts’ System 44 Students, Grades 3–11 (N=170) Performance on WJ III Basic Reading Skills Cluster by School Level, 2009–2010
Grade Level
N
Fall WJ lll Basic Reading Skills Cluster Standard Score (Percentile)
Spring WJ lll Basic Reading Skills Cluster Standard Score (Percentile)
WJ lll BRS Gain (Percentile Points)
Elementary
60
83 (13th)
87 (19th)
4
Middle
86
72 (3rd)
80 (8th)
8
High
24
54 (<1)
65 (3rd)
11
All
170
73
(4th)
80
(9th)
7
Note. The increase in score was statistically signi cant for elementary school (t=3.50, p=.00), middle school (t=5.39, p=.00), high school (t=4.14, p=.00), and overall (t=7.41, p=.00). Standard scores are rounded to the nearest integer.
Multisite
GRAPH 2
Three Public School Districts’ System 44 Students, Grades 3–11 (N=134) Performance on SRI by School Level, 2009–2010
250 200 150 125 100
75 50 25
0
All Students
(N=134)
Elementary School
(n=50)
Middle School
(n=69)
High School
(n=15)
148L
200L
Fall 2009 Spring 2010
120L
71L
55L
59L
59L
Gain: 93L
Gain: 141L
Gain: 61L
Gain: 52L
19L
Note. The gain in Lexile score was statistically signi cant for all students (t=8.08, p=.00), elementary school students (t=10.35, p=.00), middle school students (t=3.72, p=.00), and high school students (t=2.35, p=.03).
51
SRI Lexile Score
Change in SPI Fluency Score
