
Page 55 - S44 Compendium
P. 55
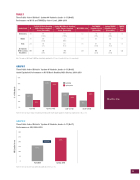
TABLE 1
Three Public School Districts’ System 44 Students, Grades 3–11 (N=85) Performance on WJ III and TOWRE by School Level, 2009–2010
Grade Level
N
Fall WJ lll Basic Reading Skills Cluster Standard Score (Percentile)
Spring WJ lll Basic Reading Skills Cluster Standard Score (Percentile)
WJ lll BRS Gain
Fall TOWRE Standard Score (Percentile)
Spring TOWRE Standard Score (Percentile)
TOWRE Total Gain
Elementary
30
81 (13th)
83 (19th)
+2
76 (5th)
80 (9th)
+4
Middle
35
69 (3rd)
72 (8th)
+3
65
66
+1
High
20
56 (<1)
62 (1st)
+5
61 (3rd)
64 (1st)
+3
All Students With Learning Disabilities
85
70
(4th)
74
(9th)
+3
68
(2nd)
71
(3rd)
+2
Note. The gains on WJ III and TOWRE are statistically signi cant (t=5.19, p=.00, and t=4.40, p=.00, respectively).
GRAPH 1
Three Public School Districts’ System 44 Students, Grades 3–11 (N=85)
Grade Equivalent Performance on WJ III Basic Reading Skills Cluster, 2009–2010
50% 40% 30% 20% 10%
0%
<2.0 GE
<2.0–2.9 GE
<3.0–3.9 GE
<4.0–4.9 GE
44%
42%
Fall 2009
Spring 2010
24%
26%
22%
20%
12%
11%
Note. The increase in percentage of students performing at the fourth-grade equivalent or higher was signi cant (t=3.34, p=.00).
GRAPH 2
Three Public School Districts’ System 44 Students, Grades 3–11 (N=71) Performance on SRI, 2009–2010
300 250 200 150 100
50 0
Fall 2009
Spring 2010
241L
Multisite
Gain: 84L
157L
Note. The increase in Lexile was statistically signi cant (t=5.41, p=.00).
53
SRI Lexile Score % of Students
