
Page 124 - Demo-Board-Book
P. 124
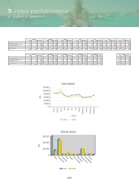
3.sales performance a. website performances
2015-2016 Twelve Month Rolling Website Performance
JANUARY
2016 2015 % Growth
FEBRUARY
2016 2015 % Growth
2.46 2.51
$348,979 $298,565 16.89%
$210.10 $231.45 -9.22%
SEPTEMBER
16 2015 % Gro
MARCH 2016 2015 %
90,219 2.18 2.56 2:35 265
$299,042 $268,257 1261
$227.58 $212.73
OCTOBER 2015 %
60,491 2.43 2.56 3.37 2.43 177 187
$179,118 $167,618 758 799
$236.30 $209.78
Visits
Pages Viewed Per Session
Average Session Duration (minutes)
Total Booked Reservations
Booked Revenue
Booked Room Nights
ADR
Visits
Pages Viewed Per Session
Average Session Duration (minutes)
Total Booked Reservations
Booked Revenue
Booked Room Nights
ADR
$345,833
2016
87,629
$264.80
2.66
3:38
269
1306
2016
67,013
$153,501
$231.87
2.44
6:28
142
662
$252,382
AUGUST
$254.42 Bo
2015-2016 Twelve Month Rolling Website Performance
2015
Pages Viewed Per Session
2.66 2.61 $345,833 $252,382
87,635
2.61 Av
3:43
T2o30t
992
2015
76,192
$197,354
2.50
5:16
$206V.6i5si
207
955
% Growth
-0.01%
erage Se
al B1o6.9o6k%
1.92%
-2.24%
37.03%
31.65%
oked Ro
% Growth
4.08%
-12.05%
-2.40%
1.55%
-31.40%
-22.22%
-30.68%
ts 12.20%
2.46 ssion Dur
ed Rese32r1v
$348,979
$210.10 om Night
2016
87,981
3:24
1661
2016
54,875
$207,795
$216.68
2.46
3:30
200
959
ation26s1
$298,565
s $231.45
SEPTEMBER
$160,499
2015
84,150
2.51 ation (
3:36
1290
2015
59,332
$187.28
2.62
3:35
196
857
% Growth
4.55%
minute
-1.99%
-5.56%
22.99%
16.89%
28.76%
-9.22%
% Growth
-7.51%
-6.11%
-2.33%
2.04%
29.47%
11.90%
15.70%
s)
2.18
$299,042
2016
111,116
$227.58
2:45
253
1314
2016
57,425
$179,118
$236.30
2.43
3.37
177
758
90,219
$268,257
$212.73
OCTOBER
$167,618
$209.78
2.56
2:35
265
1261
2015
60,491
2.56
2.43
187
799
% Growth
% Growth
23.16%
-14.84%
6.45%
-4.53%
11.48%
4.20%
6.98%
-5.07%
-5.08%
38.68%
-5.35%
6.86%
-5.13%
126.674%,
3
1
2
:38 2.29
269 215
016
$220,884
306$217.62
2016
73,467
3:23
1015
2016
59,433
$236,124
013$210.64
2.74
3.36
212
1121
$187,439
2015
70,040
$197.10
NOVEMBER
2.63
2:34
206
951
2015
63,325
$289,210
2.52
3.34
282
1468
$197.7016
% Growth
3:43
992
4.89%
-12.93%
31.82%
2304.37%
17.84%
2015 %
6.73%
10.41%
% Growth
-6.15%
8.73%
0.60%
-24.82%
-18.36%
-23.64%
,1926.92%
$200,434
2016
1.92
61,373
-2.24
2.47
3:29
16.19860
31.65
$216.92
Growth
924
2016
75,926
$263,998
2.45
3.21
251
1318
-$12200..0305
% 2015
65,554
% 2.58
% 224
$243,946
%
2:31
1193
$204.48
DECEMBER
2015
71,149
$315,664
%$210.72
2.37
3.42
256
1498
% Growth
-6.38%
-4.26%
38.41%
-19.64%3
-17.84%
-22.55%
% Growth
3:
16
6.08%
6.71%
3.38%
-6.14%
-1.95%
-16.37%
-12.02%
20
-54.945,%8
21 135
$135,668
$213.99 61
2016
58,268
24 2.41
2:34
634
72,346
2.67 3:3
$225,329
$240.74 129
2:41
2604
936
% Growth
-19.46%
6 -5.
-9.74%
-4.35%
1 -33.2822%.
-39.79%
-32.26%
0 28.
-11.11%
-1.
56%
68,492
99%192
$226,676
76%
2.42
3:18
1119
$202.57
$191,738
2015
75,327
$205.95
2.69
3:45
209
931
% Growth
2:45
1314
-9.07%
-10.04%
-12.00%
25-38.13%
Booked Revenue
ADR $264.80
$254.42
AUGUST
$197,354 955
37.03% 4.08%
-2.40%
1.55%
-31.40% -22.22% -30.68%
18.22%
20.19%
-1.64%
TOTAL
2016
2015
% Growth
862,998
875,760
-1.46%
2.45
2.59
-5.41%
3.21
3.42
-6.14%
2,547
2,727
-6.60%
wth
2,818,052
2,798,001
2016
0.72%
12,791
13,131
-2.59%
.5$12%20.32
$213.058
7,4253.39%
Pages Viewed Per Session
Average Session Duration (minutes) Total Booked Reservations
Booked Revenue
Booked Room Nights
ADR
2.44 6:28 142
$153,501 662
2.50 5:16 207
75 59,332 2.46 2.62 3:30 3:35
200 196 $207,795 $160,499
959 857 $216.68 $187.28
2015 % Growth 2016
70,040 4.89% 61,373 2.63 -12.93% 2.47 2:34 31.82% 3:29
-7 -6.11% -2.33%
2.04% 29.47% 11.90% 15.70%
e Performance JANUARY
FEBRUARY
$231.87 $206.65 12.20% APRIL
2016
87,629 2.66 3:38 269
2015 % Growth
2016
2015 % Growth
2016
MAY
2015 % Growth
87,635 -0.01% 87,981 2.61 1.92% 2.46 3:43 -2.24% 3:24
84,150 4.55% 111,116 2.51 -1.99% 2.18 3:36 -5.56% 2:45
1306 992 31.65% 1661
265 -4.53% 215
1290 28.76% 1314 1261 4.20% 1015 951 6.73% 924 1193 -22.55% 634
2016
67,013 2.44 6:28 142
2015 % Growth 2016
76,192 -12.05% 54,875 2.50 -2.40% 2.46 5:16 1.55% 3:30
2015 % Growth 2016
59,332 -7.51% 57,425 2.62 -6.11% 2.43 3:35 -2.33% 3.37
2015 % Growth 2016
60,491 -5.07% 59,433 2.56 -5.08% 2.74 2.43 38.68% 3.36
2015 % Growth 2016
63,325 -6.15% 75,926 2.52 8.73% 2.45 3.34 0.60% 3.21
2015 % Growth
71,149 6.71% 2.37 3.38% 3.42 -6.14%
AUGUST SEPTEMBER
207 -31.40% 200 153,501 $197,354 -22.22% $207,795
196 2.04% 177
$160,499 29.47% $179,118 $167,618 6.86% $236,124 $289,210 -18.36% $263,998 $315,664 -16.37%
662 955 -30.68% 959
JANUARY Visits
FEBRUARY
MARCH 87,
2015
629 APRIL87,635
MARCH
2015 % Growth 2016
90,219 23.16% 73,467 2.56 -14.84% 2.29 2:35 6.45% 3:23
JUN 2016 2 65,554 -6.38% 58,268 72,
2.58 -4.26% 2.41 2 2:31 38.41% 2:34 2
206 4.37% 180
$264.80 $254.42 4.08% $210.10 $231.45 -9.22% $227.58 $212.73 6.98% $217.62 $197.10 10.41% $216.92 $204.48 6.08%
230 16.96% 321 345,833 $252,382 37.03% $348,979
224 -19.64% 135 $213.99 $240.
OCTOBER NOVEMBER DECEMBER
261 22.99% 253
$298,565 16.89% $299,042 $268,257 11.48% $220,884 $187,439 17.84% $200,434 $243,946 -17.84% $135,668 $225,3
187 -5.35% 212
857 11.90% 758 799 -5.13% 1121 1468 -23.64% 1318 1498 -12.02%
282 -24.82% 251
$231.87 $206.65 12.20% $216.68 $187.28 15.70% $236.30 $209.78 12.64% $210.64 $197.01 6.92% $200.30 $210.72 -4.95%
-0.01%MAY 87,9
81 84JU,N1E50 4.
2015
55% JU1LY11,116
99%
2016
256 -1.95%
124
t
G
G
E 0 3 . : 2
2 9 7
