
Page 131 - Demo-Board-Book
P. 131
c. market segment
$9,000,000 $8,000,000 $7,000,000 $6,000,000 $5,000,000 $4,000,000 $3,000,000 $2,000,000 $1,000,000
$0
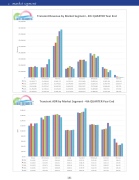
Transient Revenue by Market Segment - 4th QUARTER Year End
Group
All Inclusive
Internet
Local
Transient
Wholesale
Contract
Minivac
2012
$1,662,377
$1,616,643
$5,061,172
$1,395,115
$2,551,908
$3,879,241
$1,653,393
$405,161
2013
$1,694,414
$1,593,323
$5,576,631
$1,546,560
$2,833,459
$3,516,353
$1,410,455
$136,627
2014
$1,636,680
$1,637,347
$6,626,333
$1,836,476
$2,822,507
$3,779,600
$1,368,642
$97,230
2015
$1,784,696
$2,133,441
$7,415,535
$1,670,092
$2,848,038
$3,169,869
$848,534
$73,940
2016
$1,669,025
$2,922,799
$7,691,144
$1,417,010
$2,602,413
$3,398,565
$1,153,950
$68,720
$200.00 $180.00 $160.00 $140.00 $120.00 $100.00
$80.00 $60.00 $40.00 $20.00
$0.00
Transient ADR by Market Segment - 4th QUARTER Year End
Group
All Inclusive
Internet
Local
Transient
Wholesale
Contract
Minivac
2012
$119.82
$151.16
$161.60
$102.10
$170.74
$123.49
$104.75
$69.03
2013
$128.04
$143.93
$162.61
$103.23
$168.78
$125.21
$106.13
$53.85
2014
$118.33
$156.71
$165.04
$101.18
$171.91
$124.12
$108.55
$44.22
2015
$128.45
$157.71
$160.68
$102.32
$173.99
$122.33
$130.40
$45.28
2016
$129.20
$157.49
$152.15
$103.94
$187.04
$122.92
$117.35
$50.42
131
ADR
Revenue
