
Page 693 - SUBSEC October 2017_Neat
P. 693
- 9 -
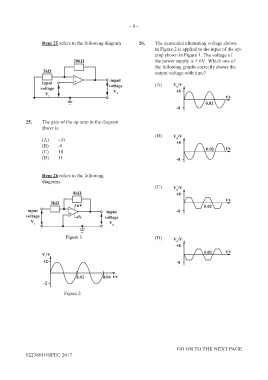
Item 25 refers to the following diagram 26. The sinusoidal alternating voltage shown
in Figure 2 is applied to the input of the op-
amp shown in Figure 1. The voltage of
20kΩ the power supply is + 6V. Which one of
the following graphs correctly shows the
2kΩ output voltage with time?
-
input + input (A) V /V
0
voltage voltage +8
V
V i 0 t/s
0.02
-8
25. The gain of the op-amp in the diagram
above is
(B) V /V
0
(A) -10 +8
(B) -9 t/s
(C) 10 0.02
(D) 11 -8
Item 26 refers to the following
diagrams.
(C) V /V
0
8kΩ +8
t/s
2kΩ +6V 0.02
input - input -8
voltage + -6V voltage
V i V 0
Figure 1 (D) V /V
0
+8
V /V 0.02 t/s
i
+2 -8
0.02 0.04 t/s
-2
Figure 2
GO ON TO THE NEXT PAGE
02238010/SPEC 2017