
Page 35 - SEC_2017WorkingDocument_Neat
P. 35
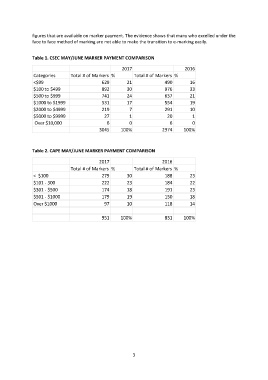
figures that are available on marker payment. The evidence shows that many who excelled under the
               face to face method of marking are not able to make the transition to e-marking easily.

               Table 1. CSEC MAY/JUNE MARKER PAYMENT COMPARISON

                                                       2017                        2016
                Categories      Total # of Markers %         Total # of Markers %
                <$99                          629        21               490        16
                $100 to $499                  892        30               976        33
                $500 to $999                  741        24               637        21
                $1000 to $1999                531        17               554        19
                $2000 to $4999                219          7              291        10
                $5000 to $9999                 27          1               20          1
                 Over $10,000                    6         0                6          0
                                             3045      100%              2974      100%


               Table 2. CAPE MAY/JUNE MARKER PAYMENT COMPARISON

                                             2017                        2016
                                Total # of Markers %         Total # of Markers %
                <  $100                       279        30               188        23
                $101 - 300                    222        23               184        22
                $301 - $500                   174        18               191        23
                $501 - $1000                  179        19               150        18
                Over $1000                     97        10               118        14


                                              951      100%               831      100%


                                                            3