
Page 65 - SEC_2017WorkingDocument_Neat
P. 65
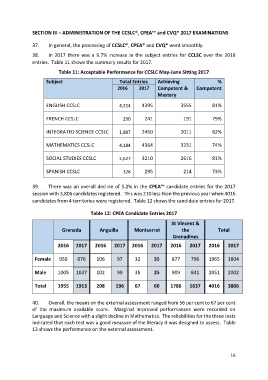
SECTION III – ADMINISTRATION OF THE CCSLC®, CPEA™ and CVQ* 2017 EXAMINATIONS


               37.     In general, the processing of CCSLC®, CPEA® and CVQ* went smoothly.
               38.     In 2017 there was a 9.7% increase in the subject  entries for CCLSC over the 2016

               entries.  Table 11 shows the summary results for 2017.
                           Table 11: Acceptable Performance for CCSLC May-June Sitting 2017

                      Subject                         Total Entries    Achieving                  %
                                                     2016      2017    Competent &      Competent
                                                                       Mastery
                      ENGLISH CCSLC                   4,314     4395             3555          81%


                      FRENCH CCSLC                      290      241               191         79%


                      INTEGRATED SCIENCE CCSLC        1,887     2450             2011          82%


                      MATHEMATICS CCSLC               4,184     4364             3231          74%

                      SOCIAL STUDIES CCSLC            2,627     3210             2616          81%


                      SPANISH CCSLC                     328      295               214         73%


               39.     There was an overall decline of 5.2% in the CPEA™ candidate entries for the 2017
               session with 3,806 candidates registered.  This was 210 less than the previous year when 4016
               candidates from 4 territories were registered.  Table 12 shows the candidate entries for 2017.

                                         Table 12: CPEA Candidate Entries 2017

                                                                             St Vincent &
                             Grenada         Anguilla        Montserrat           the             Total
                                                                              Grenadines
                           2016    2017    2016     2017    2016    2017     2016    2017     2016    2017


                Female     950     876      106      97      32      35      877      796     1965    1804


                Male       1005    1037     102      99      35      25      909      841     2051    2002

                Total      1955    1913     208     196      67      60      1786    1637     4016    3806


               40.     Overall, the means on the external assessment ranged from 56 per cent to 67 per cent
               of  the  maximum  available  score.    Marginal  improved  performances  were  recorded  on
               Language and Science with a slight decline in Mathematics.  The reliabilities for the three tests
               indicated that each test was a good measure of the literacy it was designed to assess.  Table
               13 shows the performance on the external assessment.


                                                                                                       16