Page 236 - SUBSEC October 2017_Neat
P. 236

- 11 -


    DO NOT WRITE IN THIS AREA
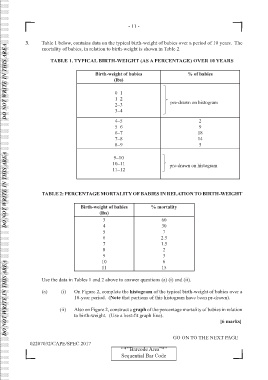
            3.      Table 1 below, contains data on the typical birth-weight of babies over a period of 10 years.  The
                    mortality of babies, in relation to birth-weight is shown in Table 2.

                       TABLE 1. TYPICAL BIRTH-WEIGHT (AS A PERCENTAGE) OVER 10 YEARS


                                           Birth-weight of babies                   % of babies
                                                    (lbs)


                                                    0–1
                                                    1–2
                                                    2–3                      pre-drawn on histogram
                                                    3–4
                                                    4–5                                  2
                                                    5–6                                  9
    DO NOT WRITE IN THIS AREA
                                                    6–7                                  18
                                                    7–8                                  14
                                                    8–9                                  5

                                                    9–10
                                                   10–11                    pre-drawn on histogram
                                                   11–12


                    TABLE 2: PERCENTAGE MORTALITY OF BABIES IN RELATION TO BIRTH-WEIGHT

                                     Birth-weight of babies         % mortality
                                             (lbs)
                                               3                         60
                                               4                         30
                                               5                         7
    DO NOT WRITE IN THIS AREA
                                               6                         2.5
                                               7                         1.5
                                               8                         2
                                               9                         3
                                              10                         6
                                              11                         15

                    Use the data in Tables 1 and 2 above to answer questions (a) (i) and (ii).


                    (a)     (i)   On Figure 2, complete the histogram of the typical birth-weight of babies over a
                                  10-year period.  (Note that portions of this histogram have been pr-drawn).

                            (ii)   Also on Figure 2, construct a graph of the percentage mortality of babies in relation
                                  to birth-weight.  (Use a best-fit graph line).
                                                                                                   [6 marks]


                                                                              GO ON TO THE NEXT PAGE
              02207032/CAPE/SPEC 2017
                                                       ‘‘*’’Barcode Area”*”
                                                       Sequential Bar Code
   231   232   233   234   235   236   237   238   239   240   241