
Page 453 - SUBSEC October 2017_Neat
P. 453
- 15 -
DO NOT WRITE IN THIS AREA
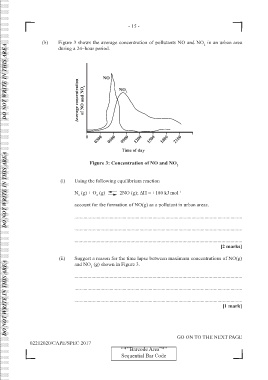
(b) Figure 3 shows the average concentration of pollutants NO and NO in an urban area
2
during a 24–hour period.
DO NOT WRITE IN THIS AREA
Figure 3: Concentration of NO and NO 2
(i) Using the following equilibrium reaction
N (g) + O (g) 2NO (g); ∆H = +180 kJ mol −1
2
2
account for the formation of NO(g) as a pollutant in urban areas.
.................................................................................................................................
.................................................................................................................................
DO NOT WRITE IN THIS AREA
.................................................................................................................................
[2 marks]
(ii) Suggest a reason for the time lapse between maximum concentrations of NO(g)
and NO (g) shown in Figure 3.
2
.................................................................................................................................
.................................................................................................................................
.................................................................................................................................
[1 mark]
GO ON TO THE NEXT PAGE
02212020/CAPE/SPEC 2017
‘‘*’’Barcode Area”*”
Sequential Bar Code