Page 758 - SUBSEC October 2017_Neat
P. 758

-2-          02238032/SPEC/K/MS/JUNE 2017

                                                          PHYSICS
                                                    UNIT 2 — PAPER 032
                                                        MARK SCHEME

                    Question 1

                                                                                                    KC UK  XS
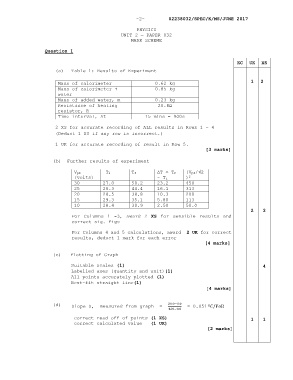
                        (a)    Table 1: Results of Experiment

                         Mass of calorimeter                      0.62 kg                                 1  2
                         Mass of calorimeter +                    0.85 kg
                         water
                         Mass of added water, m                   0.23 kg
                         Resistance of heating                     20.8Ω
                         resistor, R
                         Time interval, Δt                    15 mins = 900s

                        2 XS for accurate recording of ALL results in Rows 1 – 4
                        (Deduct 1 XS if any row is incorrect.)

                        1 UK for accurate recording of result in Row 5.
                                                                             [3 marks]

                       (b)  Further results of experiment

                                Vpk          Ti         Tf         ΔT = Tf     (Vpk/√2
                                (volts)                            - Ti        ) 2
                                30          27.0        50.2       23.2        450
                                25          28.3        44.4       16.1        313
                                20          28.5        38.8       10.3        200
                                15          29.3        35.1       5.80        113
                                10          28.4        30.9       2.50        50.0
                                                                                                          2    2
                               For Columns 1  -3,  award 2  XS for  sensible results  and
                               correct sig. figs

                               For Columns 4 and 5 calculations, award  2 UK for correct
                               results, deduct 1 mark for each error
                                                                              [4 marks]

                       (c)    Plotting of Graph

                               Suitable scales (1)                                                             4
                               Labelled axes (quantity and unit)(1)
                               All points accurately plotted (1)
                               Best-fit straight line(1)
                                                                                       [4 marks]


                       (d)     Slope S,  measured from graph  =          .   .    = 0.051 º /
                                                                            .
                                correct read off of points (1 XS)                                         1    1
                                correct calculated value   (1 UK)
                                                                               [2 marks]
   753   754   755   756   757   758   759   760   761   762   763