
Page 35 - DILMUN 14
P. 35
mcasurcments for the sccond grid is 3341, not including ﺍsmall arca covcrcd ly
heavy vegelation. Again, both thc dipole dircction and the mcasuring dircclion is
north-south. igures 10 and ١1 show thc plots of grid No, 2. The isometric
projcction clearly shows similar patterns to those found in grid No, ١, suggcsting
similar ma١-١ade structures bclow thc surface a1 the ٨orthcaslcrn part fﻥthe tcll.
The contour plot (Figure ١1) shows thc cxact location of cacl anonaly. The cnply
areas in the ١orthcastcrn and southwestern quadranls are causcd by 2ero valucs,
that is, n0 measurements have bccn takcn because of surface structurcs, such as
hcavy vegetation, which may prohibit mcasurements. The high anomaly seen as a
significant peak in the isomctric projection (Figure 10), and as a heavy contoured
circle in the contour plot (Figure 11) may have been caused by more reccnt
excavation in the area, One area of interest may be at the eastcrn half of the grid
(Figure 11) where the conductivity variation shows a rectangular pattern possibly
suggesting a house structure or similar man-made feature.
g. ﺇ
ﻎ,ﻣ،
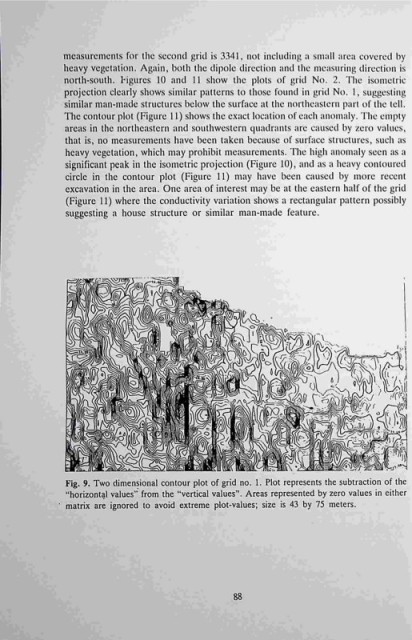
Fig, 9. Two dimensional contour plot of grid no. 1. Plot represents the subtraction of the
'horizontal values' from the "vertical values'. Areas represented by 2ero values in either
matrix are ignored to avoid extreme plot-values; si2e is 43 by 75 meters.
88