
Page 98 - BAA CAFR 2017
P. 98
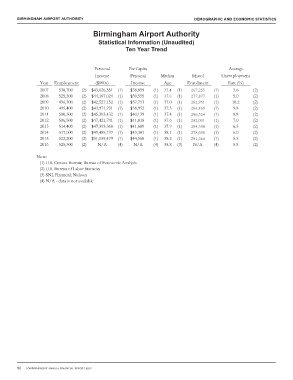
Birmingham-Hoover MSA Statistical Summary

                                        Personal       Per Capita                                Average
                                         Income        Personal     Median       School       Unemployment
                  Year  Employment       ($000s)        Income        Age      Enrollment       Rate (%)
                  2007    538,700  (2)  $43,026,551  (1)  $38,859  (1)  37.4  (1)  267,255  (1)   3.6      (2)
                  2008    525,300  (2)  $44,187,024  (1)  $39,555  (1)  37.6  (1)  277,877  (1)   5.0      (2)
                  2009    496,300  (2)  $42,527,152  (1)  $37,793  (1)  37.0  (1)  282,951  (1)   10.2     (2)
                  2010    495,400  (2)  $43,971,791  (1)  $38,952  (1)  37.3  (1)  284,469  (1)   9.8      (2)
                  2011    500,300  (2)  $45,393,432  (1)  $40,139  (1)  37.4  (1)  286,354  (1)   8.8      (2)
                  2012    506,500  (2)  $47,421,741  (1)  $41,818  (1)  37.6  (1)  282,031  (1)   7.0      (2)
                  2013    514,400  (2)  $47,393,368  (1)  $41,609  (1)  37.9  (1)  284,308  (1)   6.3      (2)
                  2014    517,000  (2)  $49,485,197  (1)  $43,301  (1)  38.1  (1)  278,605  (1)   6.0      (2)
                  2015    522,200  (2)  $51,059,479  (1)  $44,568  (1)  38.2  (1)  281,264  (1)   5.5      (2)
                  2016    525,300  (2)    N/A     (4)    N/A     (4)  38.8  (3)   N/A     (4)     5.5      (2)

                Note:
                  (1) U.S. Census Bureau; Bureau of Economic Analysis
                  (2) U.S. Bureau of Labor Statistics
                  (3) SNL Financial; Nielson
                  (4) N/A - data is not available