
Page 5 - Demo
P. 5
Key Elements of PES
For the selected geographic markets, Gray creates a dataset for all programs in IPEDS, using GrayData. Our markets usually are not MSAs or other standard market definitions. Instead, we pull all the data for a radius you choose, around each of your campuses. Using QlikView, you can evaluate campuses one at a time, in groups, or in total.
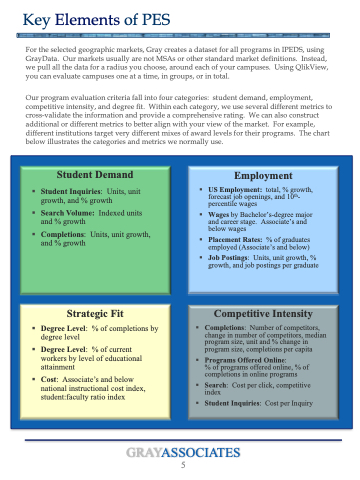
Our program evaluation criteria fall into four categories: student demand, employment, competitive intensity, and degree fit. Within each category, we use several different metrics to cross-validate the information and provide a comprehensive rating. We can also construct additional or different metrics to better align with your view of the market. For example, different institutions target very different mixes of award levels for their programs. The chart below illustrates the categories and metrics we normally use.
GRAY
Student Demand
§ Student Inquiries: Units, unit
growth, and % growth
§ Search Volume: Indexed units and % growth
§ Completions: Units, unit growth, and % growth
Strategic Fit
§ Degree Level: % of completions by
degree level
§ Degree Level: % of current workers by level of educational attainment
§ Cost: Associate’s and below national instructional cost index, student:faculty ratio index
Employment
§ US Employment: total, % growth, forecast job openings, and 10th- percentile wages
§ Wages by Bachelor’s-degree major and career stage. Associate’s and below wages
§ Placement Rates: % of graduates employed (Associate’s and below)
§ Job Postings: Units, unit growth, % growth, and job postings per graduate
Competitive Intensity
§ Completions: Number of competitors, change in number of competitors, median program size, unit and % change in program size, completions per capita
§ Programs Offered Online:
% of programs offered online, % of completions in online programs
§ Search: Cost per click, competitive index
§ Student Inquiries: Cost per Inquiry
ASSOCIATES
5
