
Page 7 - Demo
P. 7
Key Elements of PES: Scoring
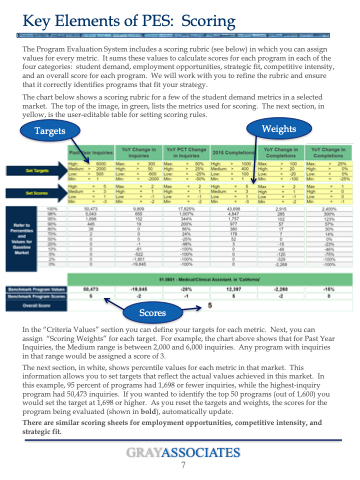
The Program Evaluation System includes a scoring rubric (see below) in which you can assign values for every metric. It sums these values to calculate scores for each program in each of the four categories: student demand, employment opportunities, strategic fit, competitive intensity, and an overall score for each program. We will work with you to refine the rubric and ensure that it correctly identifies programs that fit your strategy.
The chart below shows a scoring rubric for a few of the student demand metrics in a selected market. The top of the image, in green, lists the metrics used for scoring. The next section, in yellow, is the user-editable table for setting scoring rules.
Targets
Weights
Scores
In the “Criteria Values” section you can define your targets for each metric. Next, you can assign “Scoring Weights” for each target. For example, the chart above shows that for Past Year Inquiries, the Medium range is between 2,000 and 6,000 inquiries. Any program with inquiries in that range would be assigned a score of 3.
The next section, in white, shows percentile values for each metric in that market. This information allows you to set targets that reflect the actual values achieved in this market. In this example, 95 percent of programs had 1,698 or fewer inquiries, while the highest-inquiry program had 50,473 inquiries. If you wanted to identify the top 50 programs (out of 1,600) you would set the target at 1,698 or higher. As you reset the targets and weights, the scores for the program being evaluated (shown in bold), automatically update.
There are similar scoring sheets for employment opportunities, competitive intensity, and strategic fit.
GRAY
ASSOCIATES
7
