
Page 105 - New Employee Onboarding
P. 105
Confidential and Privileged
For The Audit and Finance Committee's Review
Work-paper #3-6:
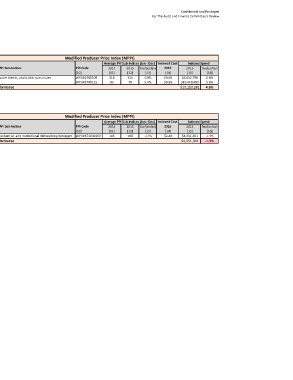
Apple Market Basket vs. Modified Producer Price Index:
2015 Performance by Category
Category: Oils
Apple Market Basket Modified Producer Price Index (MPPI)
Average Actual Store Cost (Jan - Dec) Budgeted Spend Average PPI Sub-Indices (Jan - Dec) Indexed Cost Indexed Spend
Product 2014 2015 fav/(unfav) Volume 2015 2014 2015 fav/(unfav) Referenced PPI Sub-Indices PPI Code 2014 2015 fav/(unfav) 2015 2015 fav/(unfav)
[1] [2] [3] [4] [5] [6] [7] [8] [9] [10] [11] [12] [13] [14] [15] [16]
Butter Alternative, Liquid GFGB $0.69 $0.61 11.6% 3,877,339 $2,674,720 $2,365,184 11.6% Margarine, butter blends, and butter substitutes WPU02780109 318 316 0.8% $0.68 $2,652,796 0.8%
Shortening, Creamy GFGB $0.61 $0.53 13.0% 18,019,857 $11,077,840 $9,638,859 13.0% Cooking oils WPU02780115 83 78 5.6% $0.58 $10,460,485 5.6%
Overall Performance $13,752,559 $12,004,043 12.7% Overall Performance $13,113,281 4.6%
Category: Chemicals
Commentary:
Apple Market Basket Modified Producer Price Index (MPPI)
Average Actual Store Cost (Jan - Dec) Budgeted Spend Average PPI Sub-Indices (Jan - Dec) Indexed Cost Indexed Spend
Product 2014 2015 fav/(unfav) Volume 2015 2014 2015 fav/(unfav) Referenced PPI Sub-Indices PPI Code 2014 2015 fav/(unfav) 2015 2015 fav/(unfav)
[1] [2] [3] [4] [5] [6] [7] [8] [9] [10] [11] [12] [13] [14] [15] [16]
Machine Detergent, Solid Power XL $2.35 $2.35 0.2% 1,814,936 $4,269,258 $4,261,078 0.2% Commercial, industrial, and institutional dishwashing detergent WPU0671040103 106 108 -1.9% $2.40 $4,351,301 -1.9%
Overall Performance $4,269,258 $4,261,078 0.2% Overall Performance $4,351,301 -1.9%
Sources & Notes:
[1]: Products are based on Apple Price Index.
[2]: Average actual store cost for 2014 is calculated by taking the average of prices from January 2014 through December 2014.
[3]: Average actual store cost for 2015 is calculated by taking the average of prices from January 2015 through December 2015.
[4]: Change in average actual store cost= -{[3] - [2]}/[2].
[5]: Budgeted volumes for 2015 are based on Apple Price Index.
[6]: [2] x [5].
[7]: [3] x [5].
[8]: -{[7] - [6]}/[6]. Notice that [4] & [8] have the same results.
[9]: PPI sub-indices are selected based on resemblance with products in Apple Market Basket.
[10]: See PPI Codes on the Bureau of Labor Statistics: http://www.bls.gov/news.release/pdf/ppi.pdf
[11]: Data were retrieved from the Bureau of Labor Statistic website: http://data.bls.gov/cgi-bin/srgate
[12]: Data were retrieved from the Bureau of Labor Statistic website: http://data.bls.gov/cgi-bin/srgate
[13]: Change in PPI sub-indices = -{[12] - [11]}/[11].
[14]: [2] x {1 - [13]}.
[15]: [5] x [14].
[16]: -{[15] - [6]}/[6]. Notice that [13] & [16] have the same results.