
Page 329 - Aida Hovsepian Onboarding
P. 329
Section I: 2016 Cost Management Target Calculation
Each year, the cost management target is established for each Concept Co-op based on prior years’
performance. Specifically, the median rolling two-year average performance is used as the target for
the current year. This methodology was selected and approved by the Board for the following
reasons:
It eliminates single year market anomalies
It smooths out the effect of measuring annual fixed price contracts to an active market
The target automatically adjusts up/down based on actual performance
It does a better job of incenting the correct behaviors in the purchasing managers’ day to
day responsibilities
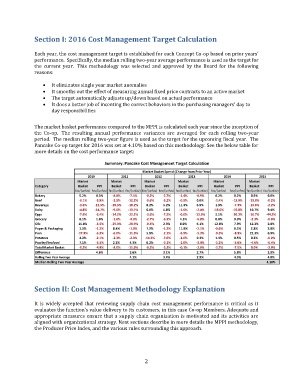
The market basket performance compared to the MPPI is calculated each year since the inception of
the Co-op. The resulting annual performance variances are averaged for each rolling two-year
period. The median rolling two-year figure is used as the target for the upcoming fiscal year. The
Pancake Co-op target for 2016 was set at 4.10% based on this methodology. See the below table for
more details on the cost performance target:
Summary: Pancake Cost Management Target Calculation
Market Basket Spend (Change from Prior Year)
2010 2011 2012 2013 2014 2015
Market Market Market Market Market Market
Category Basket PPI Basket PPI Basket PPI Basket PPI Basket PPI Basket PPI
fav/(unfav) fav/(unfav) fav/(unfav) fav/(unfav) fav/(unfav) fav/(unfav) fav/(unfav) fav/(unfav) fav/(unfav) fav/(unfav) fav/(unfav) fav/(unfav)
Bakery 5.2% 0.3% -8.8% -7.4% -0.2% -2.7% -1.4% -0.9% 0.2% 0.2% 0.5% 0.0%
Beef -0.1% -9.9% -2.5% -12.2% -9.6% -9.2% -0.5% 0.0% -1.4% -15.9% -15.0% -0.2%
Beverage -3.6% -12.5% -28.5% -18.2% 8.2% 5.2% 11.3% 6.9% 1.9% -7.3% -13.6% -2.2%
Dairy -4.8% -14.7% -9.0% -13.7% 6.0% 4.8% -1.6% -2.4% -13.0% -16.8% 10.7% 9.4%
Eggs -7.6% -6.4% -14.2% -22.1% -3.6% -7.5% -0.6% -13.6% 5.1% -26.3% -16.7% -44.3%
Grocery 6.1% 1.6% -1.6% -4.3% -2.7% -6.3% 4.5% -6.8% 0.0% 9.9% -2.3% -0.6%
Oils 14.8% -3.5% -29.3% -28.9% -0.5% 2.3% 8.0% 6.1% 12.8% 7.9% 12.2% 2.8%
Paper & Packaging 1.3% -1.2% 8.4% -1.3% 7.2% -1.2% 11.9% -2.1% -3.6% 0.2% 2.8% 2.8%
Pork -17.9% -6.3% -6.0% -11.5% 5.9% -2.1% -8.9% -5.3% -9.5% -8.9% 21.3% 6.9%
Potatoes 2.2% -2.1% -2.3% -2.3% -14.3% -7.6% -2.6% 0.3% 1.4% 0.5% 0.2% -0.2%
Poultry/Seafood 7.1% -5.5% 2.2% 4.3% 0.2% -9.1% -1.0% -3.4% -1.2% -3.0% -4.6% -0.4%
Total Market Basket -0.3% -4.9% -8.0% -11.6% -0.2% -3.3% -0.1% -2.8% -1.7% -7.5% 0.0% -3.9%
Difference 4.6% 3.6% 3.1% 2.7% 5.8% 3.9%
Rolling Two Year Average 4.1% 3.4% 2.9% 4.3% 4.8%
Median Rolling Two Year Average 4.10%
Section II: Cost Management Methodology Explanation
It is widely accepted that reviewing supply chain cost management performance is critical as it
evaluates the function’s value delivery to its customers, in this case Co-op Members. Adequate and
appropriate measures ensure that a supply chain organization is motivated and its activities are
aligned with organizational strategy. Next sections describe in more details the MPPI methodology,
the Producer Price Index, and the various rules surrounding this approach.
2