
Page 450 - Onboarding May 2017
P. 450
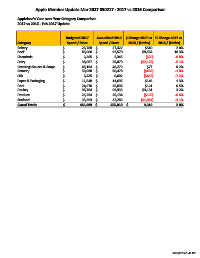
Apple Member Update Mar 2017 050217 - 2017 vs 2016 Comparison


         Applebee's Year over Year Category Comparison
         2017 vs 2016 - Feb 2017 Update


                                       Budgeted 2017     Annualized 2016  $ Change 2017 vs.  % Change 2017 vs.
         Category                      Spend / Store       Spend / Store     2016 / (Unfav)    2016 / (Unfav)
         Bakery                      $                      26,788   $                    27,327  $540    2.0%
         Beef                        $                      83,006   $                    92,570  $9,564  10.3%
         Chemicals                   $                         2,365  $                      2,345  ($20)  -0.8%
         Dairy                       $                      38,057   $                    35,879  ($2,178)  -6.1%
         Dressings Sauces & Soups    $                      46,194   $                    46,272  $77     0.2%
         Grocery                     $                      50,960   $                    50,478  ($482)  -1.0%
         Oils                        $                         6,435  $                      6,002  ($433)  -7.2%
         Paper & Packaging           $                      11,548   $                    11,695  $146    1.3%
         Pork                        $                      24,976   $                    25,096  $121    0.5%
         Poultry                     $                      96,784   $                    99,935  $3,151  3.2%
         Produce                     $                      25,294   $                    25,134  ($160)  -0.6%
         Seafood                     $                      33,293   $                    32,285  ($1,007)  -3.1%
         Grand Totals                $                    445,699 $                  455,018  $                     9,319  2.0%


                                                                                                        5/10/2017-1:41 PM