
Page 4 - Microsoft Word - Unitherm EW Report 11_7_2005.doc
P. 4
3. Visual analysis and quantification of select strains of L. monocytogenes in
biofilms
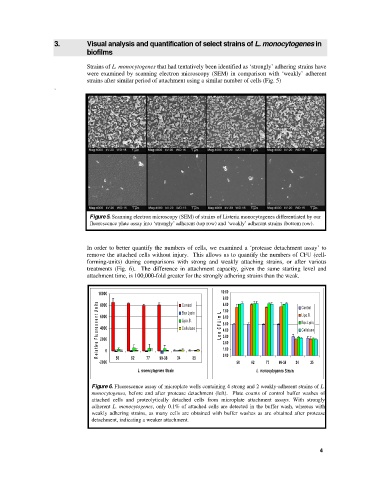
Strains of L. monocytogenes that had tentatively been identified as ‘strongly’ adhering strains have
were examined by scanning electron microscopy (SEM) in comparison with ‘weakly’ adherent
strains after similar period of attachment using a similar number of cells (Fig. 5)
.
Figure 5. Scanning electron microscopy (SEM) of strains of Listeria monocytogenes differentiated by our
fluorescence plate assay into ‘strongly’ adherent (top row) and ‘weakly’ adherent strains (bottom row).
In order to better quantify the numbers of cells, we examined a ‘protease detachment assay’ to
remove the attached cells without injury. This allows us to quantify the numbers of CFU (cell-
forming-units) during comparisons with strong and weakly attaching strains, or after various
treatments (Fig. 6). The difference in attachment capacity, given the same starting level and
attachment time, is 100,000-fold greater for the strongly adhering strains than the weak.
10.00
10000 9.00
n its 8000 Control 8.00
Bax Lysis 7.00 Control
6000 U/mL 6.00 Lipo.B.
Lipo.B. F 5.00 Bax Lysis
e la tive F lu o r esce n t U 4000 Cellulase C 4.00 Cellulase
2000 og L 3.00
2.00
0 1.00
R -2000 50 62 77 99-38 34 35 0.00 50 62 77 99-38 34 35
L. monocytogenes Strain L. monocytogenes Strain
Figure 6. Fluorescence assay of microplate wells containing 4 strong and 2 weakly-adherent strains of L.
monocytogenes, before and after protease detachment (left). Plate counts of control buffer washes of
attached cells and proteolytically detached cells from microplate attachment assays. With strongly
adherent L. monocytogenes, only 0.1% of attached cells are detected in the buffer wash, whereas with
weakly adhering strains, as many cells are obtained with buffer washes as are obtained after protease
detachment, indicating a weaker attachment.
4