
Page 23 - Module 5 - Key_Players_in_the_financial_game
P. 23
Module 5 – Understanding the game between the bulls and bears
type of supply and demand levels
The first thing you want to do is to become an expert locating these kinds of levels on any price chart,
be it on a H4, a D1 or a H1 timeframe. It doesn’t really matter which timeframe you use because price
is fractal, whatever structures and patterns there are, you will see them on all timeframes. Many say
that drawing the levels correctly can be "considered an art"; it takes time, so be patient, your mind
and eye need training, and lots of screen time till it becomes second nature to you.
Peaks and Valleys
Valleys
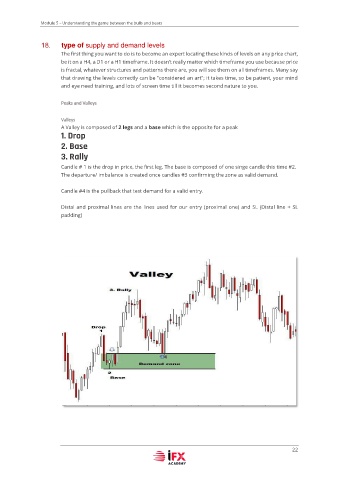
A Valley is composed of 2 legs and a base which is the opposite for a peak
1. Drop
2. Base
3. Rally
Candle # 1 is the drop in price, the first leg. The base is composed of one singe candle this time #2.
The departure/ imbalance is created once candles #3 confirming the zone as valid demand.
Candle #4 is the pullback that test demand for a valid entry.
Distal and proximal lines are the lines used for our entry (proximal one) and SL (Distal line + SL
padding)
4
22