
Page 35 - Demo
P. 35
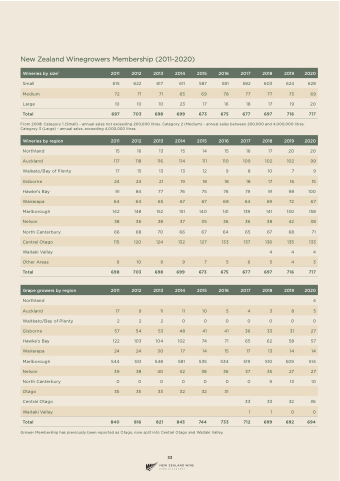
 New Zealand Winegrowers Membership (2011-2020)
 Wineries by size1
2011
2012
2013
2014
2015
2016
2017
2018
2019
2020
Small
Large
Total
615 622 617 611 587 581 582 603 624 628
10 10 10 23 17 16 18 17 19 20
697 703 698 699 673 675 677 697 716 717
 Medium
72
71
71
65
69
78
77
77
73
69
  From 2008: Category 1 (Small) - annual sales not exceeding 200,000 litres. Category 2 (Medium) - annual sales between 200,000 and 4,000,000 litres. Categroy 3 (Large) - annual sales. exceeding 4,000,000 litres.
 Wineries by region
2011
2012
2013
2014
2015
2016
2017
2018
2019
2020
Northland 15 Waikato/Bay of Plenty 17 Hawke's Bay 91 Marlborough 142 North Canterbury 66 Waitaki Valley
Total 698
Northland
Waitkato/Bay of Plenty 2 Hawke’s Bay 122 Marlborough 544
16 13 15
15 13 13 84 77 76 148 152 151 68 70 66
703 698 699
2 2 0 103 104 102 551 548 581
14 15 12 9 75 76 140 141 67 64
673 675
0 0 74 71 535 534 0 0
16 17 20 20 8 10 7 9 79 91 98 100 139 141 150 158 65 67 68 71 4 4 4 677 697 716 717
4 0 0 0 0 65 62 58 57 519 510 509 514 0 9 13 10 33 33 32 36
 Auckland
117
118
116
114
111
110
109
102
102
99
Gisborne
24
24
21
19
18
18
18
17
16
15
Wairarapa
64
64
65
67
67
68
64
69
72
67
Nelson
38
36
38
37
35
36
36
38
42
38
Central Otago
115
120
124
132
127
133
137
136
135
133
Other Areas
 9
 10
 9
 9
 7
 5
 6
 5
 4
 3
   Grape growers by region
2011
2012
2013
2014
2015
2016
2017
2018
2019
2020
 Auckland
17
9
11
11
10
5
4
3
8
5
Gisborne
57
54
53
48
41
41
36
33
31
27
Wairarapa
24
24
30
17
14
15
17
13
14
14
Nelson
39
38
40
52
38
36
37
35
27
27
NorthCanterbury Central Otago Total
0 0
0 0
Otago
35
35
33
32
32
31
Waitaki Valley
       1
 1
 0
 0
 840 816 821 843 744 733 712
699 692 694
 Grower Membership has previously been reported as Otago, now split into Central Otago and Waitaki Valley.
33
