
Page 37 - Demo
P. 37
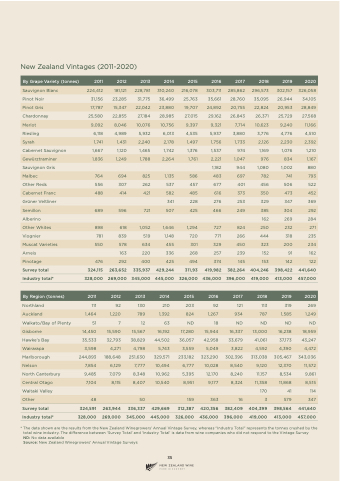
 New Zealand Vintages (2011-2020)
 By Grape Variety (tonnes)
2011
2012
2013
2014
2015
2016
2017
2018
2019
2020
Sauvignon Blanc
224,412
181,121
228,781
310,240
216,078
303,711
285,862
296,573
302,157
326,058
 Pinot Noir 31,156 Chardonnay 25,580 Riesling 6,118
23,285 22,855 4,989 1,120
307
839 163 263,652
269,000
Pinot Gris
17,787
15,347
22,042
23,880
19,707
24,892
20,755
22,824
20,953
28,849
Merlot
9,092
8,046
10,076
10,756
9,397
9,321
7,714
10,623
9,240
11,166
Syrah
1,741
1,431
2,240
2,178
1,497
1,756
1,733
2,126
2,230
2,392
Cabernet Sauvignon Sauvignon Gris Other Reds
Grüner Veltliner Alberino
1,667
556
31,775 27,184 5,932 1,465
262
519 220 335,937
345,000
130 12 38,829 251,630 8,348
336,337
345,000
36,499 28,985 6,013 1,742
537 341
1,148 336 429,244
445,000
210 63 44,502 329,571 10,962
429,669
445,000
25,763 27,015 4,535 1,376
457 228
720
268
311,93
326,000
203 ND 36,057 233,182 5,395
312,387
326,000
35,661 29,162 5,937 1,537 1,182 677 276
771 257 419,982
436,000
92 18 42,958 323,290 12,170
420,356
436,000
28,760 26,843 3,880 974 944 401 253
266
239
382,264
396,000
121 ND 33,679 302,396 8,240
382,409
396,000
35,095 26,371 3,776 1,169 1,080 456 329 162 444 152 404,246
419,000
113 ND 41,061 313,038 11,157 170 404,399
26,944 25,729 4,776 1,076 1,002 506 347 269 318 91 398,422
413,000
319
ND 37,173 305,467 8,534 41 398,564
34,105 27,568 4,510 1,210 880 522 369 284 235 162 441,640
457,000
269 ND 43,247 343,036 9,861 114 441,640
457,000
Gewürztraminer
1,836
1,249
1,788
2,264
1,761
2,221
1,047
976
834
1,167
Malbec
764
694
825
1,135
586
483
697
782
741
793
Cabernet Franc
488
414
421
582
485
616
373
350
473
452
Semillon
689
596
721
507
425
466
249
385
304
292
Other Whites
898
618
1,052
1,646
1,294
727
824
250
232
271
Viognier 781 Arneis
Muscat Varieties
550
578
634
455
301
329
450
323
200
234
Pinotage
476
292
400
425
494
374
145
153
142
122
Survey total
Industrytotal*
324,115
328,000
   By Region (tonnes)
2011
2012
2013
2014
2015
2016
2017
2018
2019
2020
Northland 111 92 Waikato/Bay of Plenty 51 7 Hawke's Bay 35,533 32,793 Marlborough 244,893 188,648
 Auckland
1,464
1,220
789
1,392
824
1,267
934
787
1,585
1,249
Gisborne
14,450
15,590
15,567
16,192
17,280
15,944
16,337
13,000
16,238
18,959
Wairarapa
3,598
4,271
4,798
5,743
3,559
5,049
3,822
4,592
4,390
4,472
Nelson
7,854
6,129
7,777
10,494
6,777
10,028
8,540
9,120
12,370
11,572
North Canterbury Waitaki Valley Survey total
Industrytotal*
9,485 7,079
324,591 263,944
328,000 269,000
419,000 413,000
Central Otago
7,104
8,115
8,407
10,540
8,951
9,177
8,324
11,358
11,868
8,515
Other
 48
  50
  159
 363
 16
 3
 579
 347
   * The data shown are the results from the New Zealand Winegrowers’ Annual Vintage Survey, whereas “Industry Total” represents the tonnes crushed by the total wine industry. The difference between ‘Survey Total’ and ‘Industry Total’ is data from wine companies who did not respond to the Vintage Survey
ND: No data available
Source: New Zealand Winegrowers' Annual Vintage Surveys
35
