
Page 40 - 2017 Year-End Summary
P. 40
Quest for Education and Arts
Development & Fundraising Annual Income Report
Fundraising % of Income from
Spring/Summer 2017 Total Income Income Fundraising
January $ 14,992.00 $ 1,365.00 9%
February $ 18,144.85 $ 6,855.18 38%
March $ 18,358.00 $ 2,576.31 14%
April $ 19,576.32 $ 4,275.41 22%
May $ 19,742.25 $ 5,704.14 29%
June $ 3,254.22 $ 607.00 19%
July $ 509.21 $ - 0%
Spring/Summer Total $ 94,576.85 $ 20,776.04 22%
Fundraising % of Income from
Summer/Fall 2017 Total Income Income Fundraising
August (Orientation) $ 1,191.62 $ 522.00 44%
September $ 18,367.06 $ 4,360.97 24%
October $ 45,299.30 $ 5,171.31 11%
November $ 36,619.70 $ 10,183.45 28%
December $ 48,929.40 $ 3,685.05 8%
Summer/Fall Total $ 150,407.08 $ 23,922.78 16%
Annual Total $ 244,983.93 $ 44,698.82 38%
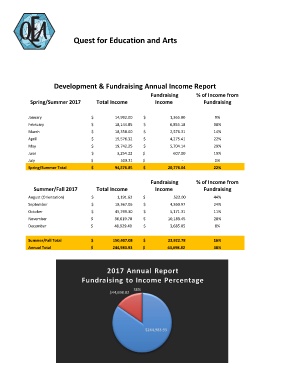
2017 Annual Report
Fundraising to Income Percentage
$44,698.82 38%
$244,983.93