
Page 107 - The World About Us
P. 107
Southern Africa
3.3
2.2.3
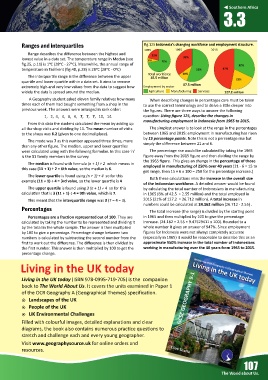
Ranges and interquartiles fig.125 Indonesia’s changing workforce and employment structure.
1965 1995 2015
Range describes the difference between the highest and
22%
lowest value in a data set. The temperature range in Medan (see 6% 72% 35%
fig.25, p.11) is 1 C (28 C - 27 C). Meanwhile, the annual range of 32%
temperature in Tashkent (fig.48, p.28) is 28 C (28 C - 0 C) 55% 47%
Total workforce 10%
The interquar le range is the difference between the upper 42.5 million
quar le and lower quar le within a data set. It aims to remove 21%
extremely high and very low values from the data to suggest how Employment by sector 87.5 million
widely the data is spread around the median. Agriculture Manufacturing Services 127.2 million
A Geography student asked eleven family rela ves how many When describing changes in percentages care must be taken
mes each of them had bought something from a shop in the to use the correct terminology and to delve a li le deeper into
previous week. The answers were arranged in rank order: the figures. There are three ways to answer the following
1, 2, 4, 4, 6, 6, 7, 7, 7, 10, 14. ques on: Using figure 125, describe the changes in
manufacturing employment in Indonesia from 1965 to 2015.
From this data the student calculated the mean by adding up
all the shop visits and dividing by 11. The mean number of visits The simplest answer is to look at the range in the percentages
to the shops was 6.2 (given to one decimal place). between 1965 and 2015: employment in manufacturing has risen
by 15 percentage points. Note this is not a percentage rise but
The mode was 7 as this number appeared three mes, more
simply the difference between 21 and 6.
than any other figure. The median, upper and lower quar les
were calculated using with the following formulae. In this case ‘n’ The percentage rise would be calculated by taking the 1965
is the 11 family members in the survey. figure away from the 2015 figure and then dividing the range by
the 1965 figure. This gives an change in the percentage of those
The median is found with formula (n + 1) ÷ 2 which means in
employed in manufacturing of 250% over 40 years (21 - 6 = 15 to
this case (11 + 1) ÷ 2 = 6th value, so the median is 6.
get range, then 15 ÷ 6 x 100 = 250 for the percentage increase.)
The lower quar le is found using (n + 1) ÷ 4 so for this
Both these calcula ons miss the increase in the overall size
example (11 + 1) ÷ 4 = 3rd value, so the lower quar le is 4
of the Indonesian workforce. A detailed answer would be found
The upper quar le is found using 3 (n + 1) ÷ 4 so for this by calcula ng the total number of Indonesians in manufacturing
calcula on that is 3 (11 + 1) ÷ 4 = 9th value, which is 7. in 1965 (6% of 42.5 = 2.55 million) and the total employed in
This meant that the interquar le range was 3 (7 – 4 = 3). 2015 (21% of 127.2 = 26.712 million). A total increase in
numbers could be calculated at 24.162 million (26.712 - 2.55) .
Percentages
The total increase (the range) is divided by the star ng point
Percentages are a frac on represented out of 100. They are in 1965 and then mul plied by 100 to give the percentage
calculated by taking the number to be represented and dividing it increase. (24.162 ÷ 2.55 = 9.47529411 x 100). Rounded to a
by the total in the whole sample. The answer is then mul plied whole number it gives an answer of 947%. Since employment
by 100 to give a percentage. Percentage change between two figures for Indonesia were not always completely accurate
numbers is calculated by subtrac ng the second number from the (especially in 1965) it would be reasonable to describe this as an
first to work out the difference. The difference is then divided by approximate 950% increase in the total number of Indonesians
the first number. This answer is then mul plied by 100 to get the working in manufacturing over the 40 years from 1965 to 2015.
percentage change.
Living in the UK today
Living in the UK today (ISBN 978-0995-719-705) is the companion
book to The World About Us. It covers the units examined in Paper 1
of the OCR Geography A (Geographical Themes) specification.
¤ Landscapes of the UK
¤ People of the UK
¤ UK Environmental Challenges
Filled with colourful images, detailed explanations and clear
diagrams, the book also contains numerous practice questions to
stretch and challenge each and every young geographer.
Visit www.geographysource.uk for online orders and
resources.
107
The World about Us.