
Page 79 - The World About Us
P. 79
Grangemouth
1.1.1
1.1.1
2.3.2
2.2.3
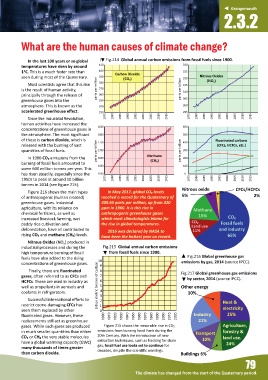
What are the human causes of climate change?
In the last 100 years or so global Fig.214 Global annual carbon emissions from fossil fuels since 1900.
410
temperatures have risen by around 410 330
400
1 C. This is a much faster rate than 400 325
Carbon Dioxide
seen during most of the Quaternary. 390 (CO₂) 320 Nitrous Oxides
parts per million
(NO )
380
Most scien sts agree that this rise 380 315 X
370
370
is the result of human ac vity, parts per million 390 parts per billion 310
principally through the release of 360
360
greenhouse gases into the 350 305
350
atmosphere. This is known as the 340 300
340
accelerated greenhouse effect. 330 295
330
Since the Industrial Revolu on, 1975 1975 1980 1980 1985 1985 1990 1990 1995 1995 2000 2000 2005 2005 2010 2010 2015 2015 1975 1980 1985 1990 1995 2000 2005 2010 2015
human ac vi es have increased the
1850 600
concentra ons of greenhouse gases in
the atmosphere. The most significant 1800 500
of these is carbon dioxide, which is 1750 400 Fluorinated carbons
released with the burning of vast (CFCs, HCFCs, etc.)
quan es of fossil fuels. parts per billion 1700 parts per trillion 300
In 1900 CO₂ emissions from the 1650 Methane 200
burning of fossil fuels amounted to (CH₄)
1600 100
some 600 million tonnes per year. This
has risen steadily, especially since the 1550 0
1950s to peak at around 10 billion 1975 1975 1980 1980 1985 1985 1990 1990 1995 1995 2000 2000 2005 2005 2010 2010 2015 2015 1975 1980 1985 1990 1995 2000 2005 2010 2015
tonnes in 2014 (see figure 215).
Nitrous oxide CFCs/HCFCs
Figure 216 shows the main types In May 2017, global CO₂ levels
of anthropogenic (human created) reached a record for the Quaternary of 6% 2%
greenhouse gases. Industrial 409.65 parts per million, up from 320
agriculture, with its reliance on ppm in 1960. It is this rise in Methane
chemical fer lizers, as well as anthropogenic greenhouse gases 16%
increased livestock farming, wet which most climatologists blame for CO₂
paddy rice cul va on and the rise in global temperatures. CO₂ Fossil fuels
Land use
deforesta on, have all contributed to 11% and industry
2016 was declared by NASA to
rising CO₂ and methane (CH₄) levels. 65%
have been the ho est year on record.
Nitrous Oxides (NO ) produced in
X
industrial processes and during the Fig.215 Global annual carbon emissions
high temperature burning of fossil from fossil fuels since 1900.
fuels have also added to the rising 10 Fig.216 Global greenhouse gas
concentra ons of greenhouse gases. 9 emissions by gas, 2014 (source IPCC).
Finally, there are fluorinated 8
gases, o en referred to as CFCs and 7 Fig.217 Global greenhouse gas emissions
by sector, 2014 (source IPCC).
HCFCs. These are used in industry as 6
well as propellants in aerosols and billion metric tonnes of carbon 5 Other energy
coolants in refrigerators. 4 3 10%
Successful interna onal efforts to 2
restrict ozone-damaging CFCs has 1 Heat &
seen them replaced by other 0 electricity
fluorinated gases. However, these 1900 1910 1920 1930 1940 1950 1960 1970 1980 1990 2000 2010 2020 Industry 25%
replacements s ll act as greenhouse 21%
gases. While such gases are produced Figure 215 shows the inexorable rise in CO₂ Agriculture,
in much smaller quan es than either emissions from burning fossil fuels during the Transport forestry &
CO₂ or CH₄ the very stable molecules 20th Century. With the introduc on of new land use.
extrac on techniques, such as fracking for shale 10%
have a global warming capacity (GWC) 24%
gas, fossil fuel use looks set to con nue for
many thousands of mes greater
than carbon dioxide. decades, despite the scien fic warnings. Buildings 6%
79
The climate has changed from the start of the Quaternary period.