
Page 15 - Annual Report - Final - Spread - June 2019
P. 15
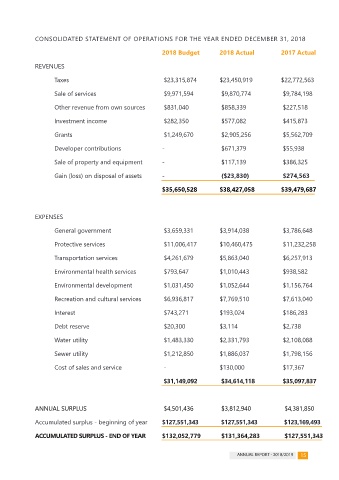
CONSOLIDATED STATEMENT OF OPERATIONS FOR THE YEAR ENDED DECEMBER 31, 2018
 FINANCIAL                                                2018 Budget         2018 Actual           2017 Actual

 STATEMENTS  REVENUES


 CONSOLIDATED STATEMENT OF FINANCIAL POSITION FOR THE YEAR ENDED DECEMBER 31, 2018       Taxes    $23,315,874     $23,450,919      $22,772,563

 2018  2017         Sale of services                       $9,971,594          $9,870,774            $9,784,198

 FINANCIAL ASSETS            Other revenue from own sources    $831,040        $858,339              $227,518

    Cash      $36,691,336    $33,830,155     Investment income    $282,350       $577,082            $415,873

    Accounts receivable      $4,600,470      $4,352,361     Grants    $1,249,670      $2,905,256       $5,562,709

    Inventory for resale      $53,268      $61,746     Developer contributions   -          $671,379        $55,938

    Long-term Investments      $2,171,135  $2,543,023     Sale of property and equipment   -          $117,139       $386,325

           $43,516,209     $40,787,285                   Gain (loss) on disposal of assets   -            ($23,830)         $274,563

                                                          $35,650,528         $38,427,058           $39,479,687

 LIABILITIES

    Accounts payable and accrued liabilities   $6,488,610      $5,038,870  EXPENSES

    Deferred revenue      $3,830,068      $3,574,387     General government    $3,659,331      $3,914,038       $3,786,648

    Refundable deposits      $351,227      $357,402     Protective services    $11,006,417      $10,460,475               $11,232,258

    Debenture debt      $10,163,466     $10,479,600     Transportation services    $4,261,679      $5,863,040       $6,257,913

 $20,833,371     $19,450,259     Environmental health services    $793,647       $1,010,443          $938,582

                    Environmental development              $1,031,450         $1,052,644             $1,156,764

 NET FINANCIAL ASSETS      $22,682,838     $21,337,026     Recreation and cultural services    $6,936,817      $7,769,510        $7,613,040

                    Interest                               $743,271           $193,024               $186,283

 NON-FINANCIAL ASSETS            Debt reserve              $20,300            $3,114                 $2,738

    Inventory of supplies      $488,077      $442,651     Water utility    $1,483,330       $2,331,793        $2,108,088

    Prepaid expenses       $201,989      $154,938     Sewer utility    $1,212,850      $1,886,037       $1,798,156

    Tangible Capital Assets      $107,905,268     $105,513,395     Cost of sales and service    -          $130,000        $17,367

    Intangible assets      $86,111  $103,333               $31,149,092         $34,614,118           $35,097,837

 $108,681,445    $106,214,317

             ANNUAL SURPLUS                                $4,501,436          $3,812,940             $4,381,850

 ACCUMULATED SURPLUS      $131,364,283    $127,551,343  Accumulated surplus - beginning of year    $127,551,343     $127,551,343        $123,169,493

             ACCUMULATED SURPLUS - END OF YEAR            $132,052,779         $131,364,283           $127,551,343


 14  ANNUAL REPORT - 2018/2019                                                      ANNUAL REPORT - 2018/2019  15