Page 34 - BACC Report On-line EB 2017
P. 34

Draft Report on European Baccalaureate 2017

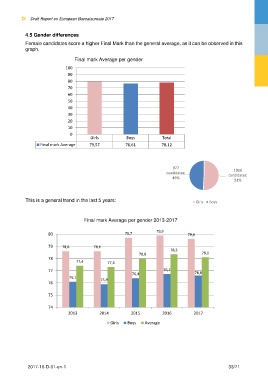
            4.5 Gender differences
            Female candidates score a higher Final Mark than the general average, as it can be observed in this
            graph.

                                  Final mark Average per gender

                              100
                               90
                               80
                               70

                               60

                               50
                               40
                               30

                               20

                               10
                                0
                                         Girls           Boys            Total

                   Final mark Average    79,57           76,61           78,12


                                                                              977                        1016
                                                                           candidates;                candidates;
                                                                              49%                        51%


            This is a general trend in the last 5 years:                                Girls  Boys


                                      Final mark Average per gender 2013-2017

                                                                      79,9
                      80                                 79,7                       79,6

                      79     78,6          78,6
                                                                             78,3
                                                               78,0                        78,1
                      78           77,4          77,3

                      77                                    76,4          76,7          76,6
                                76,1
                                              75,9
                      76


                      75

                      74
                               2013          2014          2015          2016          2017
                                                  Girls   Boys   Average


             2017-10-D-01-en-1                                                                         33/71
   29   30   31   32   33   34   35   36   37   38   39