
Page 52 - bne magazine February 2024_20240206
P. 52
52 I Eastern Europe bne February 2024
the Russian air force. In addition, the Dubna machine building plant has seen construction, as has a facility in Kronstad, which plays a key role for missile production on behalf of the state-owned Tactical Missile Arms Cooperation.”
Non-western-made technology makes up the lion’s share of the technology imports, with China accounting for just under a third of the total, or $1.9bn, according to KSE estimates. Beijing has been careful not to openly export arms and weapons to Russia for fear
of bringing down secondary sanctions on itself, but the volume of dual-use technology that exists in the grey zone between banned and not banned exports to Russia has soared in the last year.
For example, China has been the main supplier of earth moving equipment that allows Russia to strengthen its defence network, but has avoided sending Russia rockets and ammo.
In the period before the full-scale invasion (January 2021-February 2022), Russia imported an average of $1.04bn in battlefield goods per month and $3.21bn in critical components. Numbers were particularly high in the fourth quarter of 2021 – $1.59bn and $4.31bn per month, respectively – as Russia prepared for the war in anticipation of export controls being imposed.
Russia appears to have been able to rework supply chains of the generic battlefield goods, and monthly average imports of $932mn were only 10.0% lower in 2023 compared to the pre- sanctions period, reports KSE.
The situation is noticeably different for the broader set of critical components, where a monthly average of $2.29bn
in 2023 represents a 28.8% drop vs. before February 2022. Thus, export controls appear to show some results for certain goods.
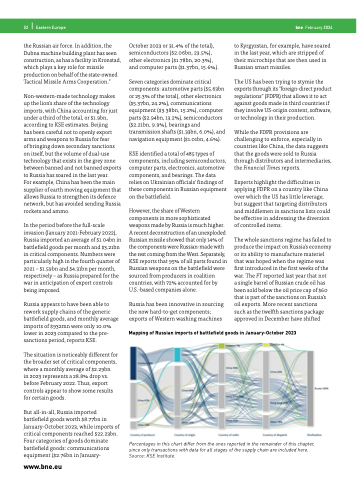
But all-in-all, Russia imported battlefield goods worth $8.77bn in January-October 2023, while imports of critical components reached $22.23bn. Four categories of goods dominate battlefield goods: communications equipment ($2.76bn in January-
www.bne.eu
October 2023 or 31.4% of the total), semiconductors ($2.06bn, 23.5%), other electronics ($1.78bn, 20.3%), and computer parts ($1.37bn, 15.6%).
Seven categories dominate critical components: automotive parts ($5.63bn or 25.3% of the total), other electronics ($5.37bn, 24.2%), communications equipment ($3.38bn, 15.2%), computer parts ($2.94bn, 13.2%), semiconductors ($2.21bn, 9.9%), bearings and transmission shafts ($1.33bn, 6.0%), and navigation equipment ($1.01bn, 4.6%).
KSE identified a total of 485 types of components, including semiconductors, computer parts, electronics, automotive components, and bearings. The data relies on Ukrainian officials' findings of these components in Russian equipment on the battlefield.
However, the share of Western components in more sophisticated weapons made by Russia is much higher. A recent deconstruction of an unexploded Russian missile showed that only 14% of the components were Russian-made with the rest coming from the West. Separately, KSE reports that 95% of all parts found in Russian weapons on the battlefield were sourced from producers in coalition countries, with 72% accounted for by U.S.-based companies alone.
Russia has been innovative in sourcing the now hard-to-get components; exports of Western washing machines
to Kyrgyzstan, for example, have soared in the last year, which are stripped of their microchips that are then used in Russian smart missiles.
The US has been trying to stymie the exports through its "foreign-direct product regulations" (FDPR) that allows it to act against goods made in third countries if they involve US-origin content, software, or technology in their production.
While the FDPR provisions are challenging to enforce, especially in countries like China, the data suggests that the goods were sold to Russia through distributors and intermediaries, the Financial Times reports.
Experts highlight the difficulties in applying FDPR on a country like China over which the US has little leverage, but suggest that targeting distributors and middlemen in sanctions lists could be effective in addressing the diversion of controlled items.
The whole sanctions regime has failed to produce the impact on Russia’s economy or its ability to manufacture materiel that was hoped when the regime was first introduced in the first weeks of the war. The FT reported last year that not
a single barrel of Russian crude oil has been sold below the oil price cap of $60 that is part of the sanctions on Russia’s oil exports. More recent sanctions such as the twelfth sanctions package approved in December have shifted
Mapping of Russian imports of battlefield goods in January-October 2023
Percentages in this chart differ from the ones reported in the remainder of this chapter, since only transactions with data for all stages of the supply chain are included here. Source: KSE Institute.
