
Page 75 - SE Outlook Regions 2023
P. 75
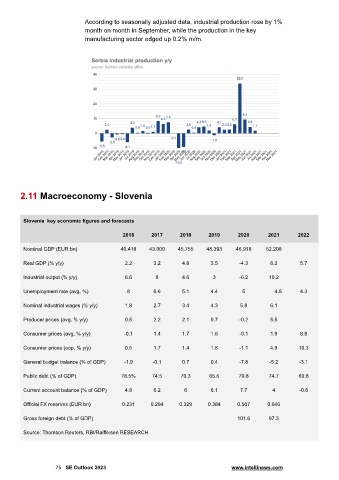
According to seasonally adjusted data, industrial production rose by 1%
                               month on month in September, while the production in the key
                               manufacturing sector edged up 0.2% m/m.


        2.11 Macroeconomy - Slovenia


         Slovenia  key economic figures and forecasts

                                            2016      2017      2018      2019       2020      2021       2022

         Nominal GDP (EUR bn)              40.418     43.000    45.755    48.393    46.918     52.208

         Real GDP (% y/y)                    2.2       3.2       4.8       3.5       -4.3       8.2        5.7

         Industrial output (% y/y)           6.6        8        4.6        3        -6.2       10.2

         Unemployment rate (avg, %)           8        6.6       5.1       4.4        5           4.8      4.3

         Nominal industrial wages (% y/y)    1.8       2.7       3.4       4.3       5.8        6.1

         Producer prices (avg, % y/y)        0.5       2.2       2.1       0.7       -0.2       5.5

         Consumer prices (avg, % y/y)        -0.1      1.4       1.7       1.6       -0.1       1.9        8.8


         Consumer prices (eop, % y/y)        0.5       1.7       1.4       1.8       -1.1       4.9       10.3

         General budget balance (% of GDP)   -1.9      -0.1      0.7       0.4       -7.8       -5.2      -3.1

         Public debt (% of GDP)             78.5%      74.5      70.3      65.6      79.8       74.7      69.8

         Current account balance (% of GDP)  4.8       6.2        6        6.1       7.7         4        -0.6

         Official FX reserves (EUR bn)      0.231     0.294     0.329     0.384     0.507      0.646

         Gross foreign debt (% of GDP)                                              101.6       97.3

         Source: Thomson Reuters, RBI/Raiffeisen RESEARCH


                     75 SE Outlook 2023                                           www.intellinews.com