
Page 29 - TURKRptOct22
P. 29
3.0 Macro Economy
Main Macro Indicators
GDP Growth (y/y, %)
Electricity Consumption (y/y)
Employed (active, mn)
Population (mn)
GDP (per capita, $)
GDP (current, TRYbn)
GDP (current prices, $bn)
Inflation (y/y, %, eop)
Lira-loans (%, y/y)
Policy Rate (%, active, eop)
CA Balance ($bn, Jul)
CA Balance/GDP (%)
Budget (TRYbn, Aug)
Budget Balance/GDP (%)
USD/TRY (eop)
2019
0.9
-0.6
26.7
83.2
9,127
4,318
760
11.8
13.9
11.4
1.67
0.2
-124
-2.9
5.95
2020
1.8
0.1
24.1
83.6
8,599
5,047
717
14.6
43.3
17.0
-35.5
-5.0
-173
-3.4
7.44
Q1-21
7.3
5.7
25.8
-
-
1,393
189
16.2
34.4
19.0
-7.5
-4.0
23
1.6
8.24
Q2
21.9
25.8
26.6
-
-
1,586
189
17.5
17.5
19.0
-5.9
-3.1
-55
-3.5
8.70
Q3
7.5
11.6
27.1
-
-
1,915
225
19.6
13.7
18.0
2.2
1.0
-29
-1.5
8.89
Q4
9.1
8.9
28.6
-
-
2,314
199
36.1
20.4
14.0
-3.7
-1.8
-131
-5.7
13.3
2021
11.0
12.4
27.0
84.7
9,539
7,209
803
36.1
20.4
14.0
-14.9
-1.9
-192
-2.7
13.3
Q1-22
7.3
4.6
27.9
-
-
2,496
180
61.1
33.2
14.0
-19.1
-10.6
30.8
1.2
14.7
Q2
7.6
1.2
29.7
-
-
3,419
219
78.6
55.7
14.0
-13.3
62.8
16.7
Q3
-
-3.1
-
-
-
-
-
83.5
68.6
12.0
-4.0
-6.1
-
-60.4
1.8
-
18.5
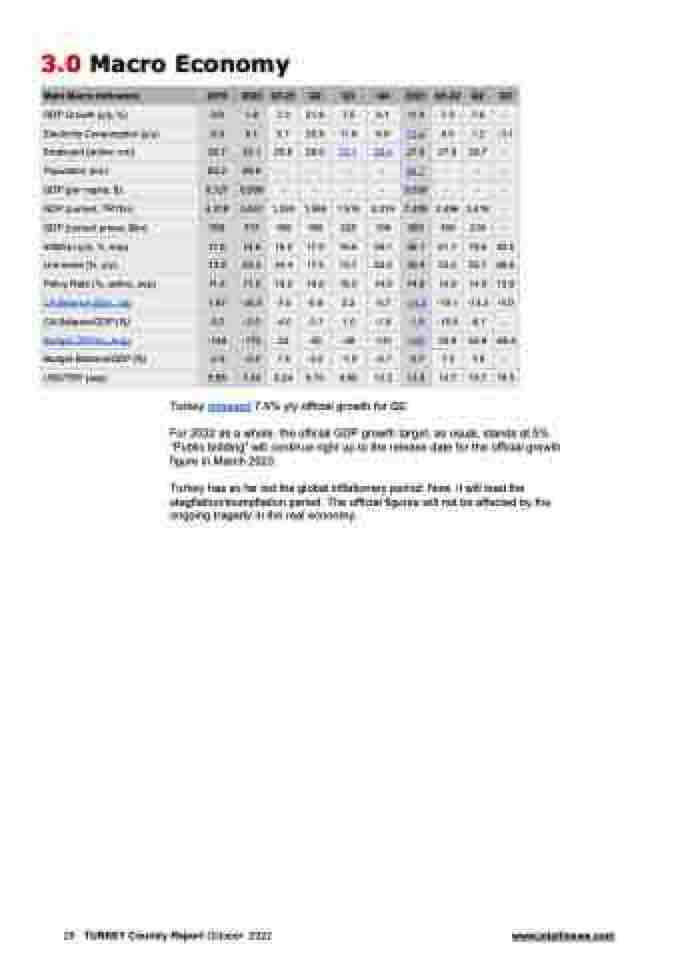
Turkey released 7.6% y/y official growth for Q2.
For 2022 as a whole, the official GDP growth target, as usual, stands at 5%. “Public bidding” will continue right up to the release date for the official growth figure in March 2023.
Turkey has so far led the global inflationary period. Now, it will lead the stagflation/slumpflation period. The official figures will not be affected by the ongoing tragedy in the real economy.
29 TURKEY Country Report October 2022 www.intellinews.com
