
Page 23 - RusRPTJuly18
P. 23
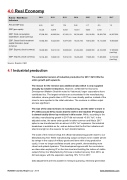
4.0  Real Economy
Russia - Main Macro Indicators
2011 2012 2013 2014 2015 2016 2017
Annual GDP (y/y)
4.26 3.41 1.34 0.64 -3.7 -0.5 1.5
GDP (per capita)
13,324 14,079 15,531 13,873 9,055 8,731 /
GDP: Final consumption expenditure, (local currency)
37,208,226 42,205,094 47,163,119 56,336,400 59,116,800 59,822,700 64,637,500
GDP: Gross fixed investment capital formation, (local currency)
13,982,500 15,223,900 15,077,000 16,436,100 16,812,800 18,112,400 19,944,000
GDP: Exports, (local currency)
16,940,900 18,413,100 18,936,600 21,464,200 23,606,500 22,124,300 17,083,600 (Jan-Sep)
GDP: Imports, (local currency)
12,164,400 13,848,100 15,014,100 16,296,400 17,095,200 17,685,800 13,716,100 (Jan-Sep)
Source: Rosstat, CEIC
4.1  Industrial production
The substantial revision of industrial production for 2017-1Q18 lifts the entire growth path upwards.
The reason for the revision was additional data which is only supplied annually by smaller enterprises.  However, as Minister for Economic Development Maksim Oreshkin noted to Vedomosti, larger corporations have contributed too. The largest revisions are concentrated in the manufacturing industries, where growth rates in 2017 are now robustly positive, instead of the close to zero reported in the initial estimates. The revisions in utilities output are less significant.
The size of the data revisions in manufacturing, and the latter’s share in IP’s GVA (around 50%) means that the shift in the headline IP trajectory is almost totally driven by revisions in this sector . While, according to the old data, manufacturing growth in 2017 did not exceed +5.6% YoY, in the adjusted series, the same order growth is rather common and May’s 2017 spike is now transformed into an almost +9.0% YoY expansion. No industrial breakdown is available so far, and we believe that the first tier indicators will shed more light on the reasons for such transformations.
The scale of the revision brings the official manufacturing growth closer to our Manufacturing IVO. While manufacturing output continues to be volatile (driven by swings in the output of military goods and items with a long production cycle), it now no longer oscillates around zero growth, demonstrating more robust and upbeat dynamics. This development agrees with the conclusions we drew when exploring IP on the item level and building the indices of visible output (IVOs). Our Manufacturing IVO saw a marked recovery from 2016, as did real wages, with the expansion reaching 10% YoY in 2017.
Data adjustments are less sizable in mining & quarrying, electricity generation
RUSSIA Country Report  July 2018 www.intellinews.com
