
Page 32 - RusRPTJuly18
P. 32
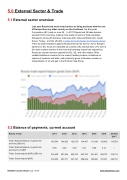
5.0  External Sector & Trade 5.1  External sector overview
Last year Russia had more trade barriers to doing business with the rest of Europe than any other country on the Continent , the European Commission (EC) said on June 28. In 2017 Russia had 36 trade barriers erected for EU countries, making it the leader in terms of trade obstacles followed by China (25 barriers), Indonesia (23), India and Brazil (21), South Korea, Turkey, and the US (20), a  study by the European Commission shows . There 22 trade limitations against Russia enforced by the EU. As for Russia's barriers for EU, those are classified as customs (19) and domestic (17). One of the main customs barriers is the food and beverage import ban imposed by Russia as counter-sanction against the EU, US, and other states. Other notable limitations concern the car market, leather produce, limitations on imports of livestock and birds, and exclusivity given to Russian vessels on transportation of oil and gas in the Northern Sea Route.
5.2  Balance of payments, current account
Russia -Trade 2011 2012 2013 2014 2015 2016 Jan-Nov 2017
Trade: External balance on goods and services (USD mn)
162,564 148,023 123,679 134,497 111,638 103,425 115,554
Trade: External balance on goods and services (% of GDP)
8.05 6.66 5.39 6.41 8.06 5.16 /
Trade: Goods exports (BoP) (USD mn)
515,409 527,434 523,275 497,763 341,467 285,772 319,712
Trade: Goods imports (BoP)
318,555 335,771 341,337 308,026 193,952 191,671 204,157
RUSSIA Country Report  July 2018 www.intellinews.com
