
Page 49 - RusRPTFeb19
P. 49
saw worse performance despite overall sector growth, with net profit down 22.3% largely due to decreasing grain prices
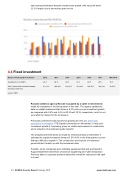
4.4 Fixed investment
Russia -Fixed capital investment 2012 2013 2014 2015 2016 2017 Mar-2018
Investment (% of GDP)
24.3 22.9 22.0 21.4 22.5 23.5 15.3
GDP: Gross fixed investment capital formation (USD mn)
471,337 496,982 428,573 276,240 280,350 342,294 58,303
source: CEIC
Russian statistics agency Rosstat is puzzled by a spike in investments
made by companies in the third quarter of this year. The agency updated its data on capital investment that shows a 5.2% year-on-year investment growth as compared with 2.8% and 3.6% in 2Q18 and 1Q18, respectively, and it is not sure what the reason for the increase is.
Previously investment was reported as growing at 5.5% y/y, which was puzzling to the analysts. VTB Capital commented on November 21 that such investment growth is "surprising, given no visible improvement in construction and a reduction of investment goods imports."
The analysts and think-tanks surveyed by Vedomosti daily on December 3 estimate the capital investment bump at 3.5%-4.9% in the third quarter, but are finding it difficult to explain it. The construction and imports of investment goods still don't match up with the investment data.
Possibly, some companies were installing equipment that was purchased in August-September amid fears of sanction toughening and ruble devaluation. Previous data on corporate profits showed that overall the real sector had cash to invest.
49 RUSSIA Country Report February 2019 www.intellinews.com
