
Page 26 - The Power of Light, Colour and Sound for Health and Wellness draft
P. 26
Auditory Results
Before AIT all of the students had hearing generally classed as ‘within normal limits’. None exhibited any serious hearing defcit that would normally attract attention, although the responses of participant 3, especially with her left ear, were of potential concern. Out of the group of twelve students, eight (66%) showed hypersensitivity (oversensitive) peaks at one or more frequencies. Three students (25%) had hypersensitive peaks on the right ear only, fve (42%) on the left ear only. One student (8%) was hypersensitive on both ears. There were fve students (42%) with some residual hypersensitivity at the end of AIT but the peaks were less steep and there were fewer of them.
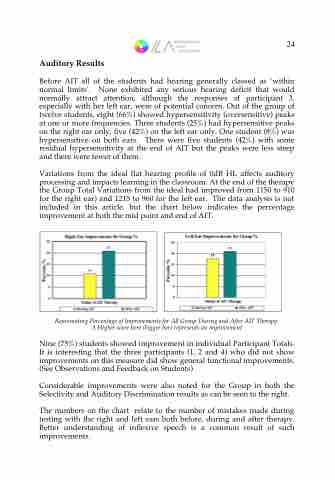
Variations from the ideal fat hearing profle of 0dB HL affects auditory processing and impacts learning in the classroom. At the end of the therapy the Group Total Variations from the ideal had improved from 1150 to 910 for the right ear) and 1215 to 960 for the left ear. The data analysis is not included in this article, but the chart below indicates the percentage improvement at both the mid point and end of AIT.
Representing Percentage of Improvements for All Group During and After AIT Therapy. A Higher score here (bigger bar) represents an improvement
Nine (75%) students showed improvement in individual Participant Totals. It is interesting that the three participants (1, 2 and 4) who did not show improvements on this measure did show general functional improvements. (See Observations and Feedback on Students)
Considerable improvements were also noted for the Group in both the Selectivity and Auditory Discrimination results as can be seen to the right.
The numbers on the chart relate to the number of mistakes made during testing with the right and left ears both before, during and after therapy. Better understanding of infexive speech is a common result of such improvements.
24
