
Page 17 - Statistices of Strategic Road Network (SSRN) 2017-18
P. 17
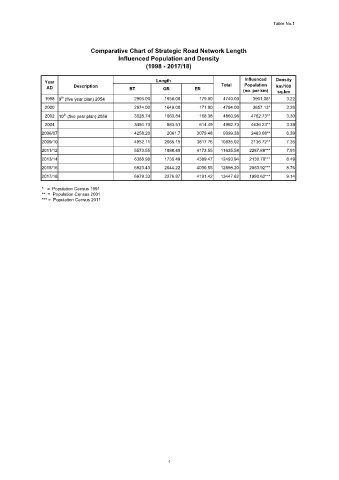
Table No.1


                                 Comparative Chart of Strategic Road Network Length
                                           Influenced Population and Density
                                                    (1998 - 2017/18)


                 Year                                   Length                         Influenced   Density
                 AD        Description        BT          GR         ER        Total   Population   km/100
                                                                                      (no. per km)  sq.km
                       th
                 1998 9  (five year plan) 2054  2905.00    1656.00     179.00  4740.00    3901.08*    3.22
                 2000                           2974.00    1649.00     171.00  4794.00    3857.13*    3.26
                       th
                 2002 10  (five year plan) 2058  3028.74   1663.84     168.38  4860.96   4762.73**    3.30
                 2004                           3494.73     883.51     614.49  4992.73   4636.23**    3.39
                2006/07                         4258.20     2061.7    3079.48  9399.38   2463.08**    6.39
                2009/10                         4952.11    2065.15    3817.76  10835.02  2136.72**    7.36
                2011/12                         5573.55    1888.49    4173.55  11635.58  2287.88***   7.91
                2013/14                         6368.98    1735.49    4389.47  12493.94  2130.70***   8.49
                2015/16                         6823.43    2044.22    4030.55  12898.20  2063.92***   8.76
                2017/18                         6979.33    2276.87    4191.42  13447.62  1980.62***   9.14

                *   =  Population Census 1991
                **  =  Population Census 2001
                *** =  Population Census 2011


                                                            1