Page 90 - RedOakPDContactReport2018
P. 90

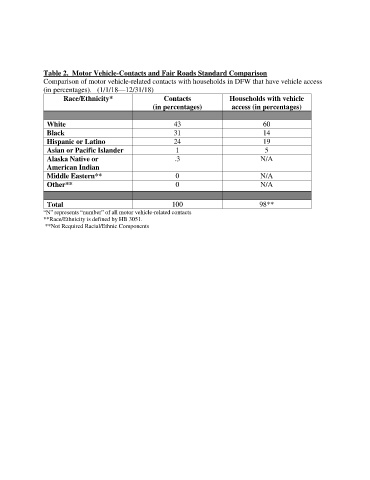
Table 2.  Motor Vehicle-Contacts and Fair Roads Standard Comparison
               Comparison of motor vehicle-related contacts with households in DFW that have vehicle access
               (in percentages).   (1/1/18—12/31/18)
                      Race/Ethnicity*                  Contacts              Households with vehicle
                                                    (in percentages)          access (in percentages)

                 White                                     43                           60
                 Black                                     31                           14
                 Hispanic or Latino                        24                           19
                 Asian or Pacific Islander                 1                             5
                 Alaska Native or                          .3                          N/A
                 American Indian
                 Middle Eastern**                          0                           N/A
                 Other**                                   0                           N/A


                 Total                                    100                          98**
               “N” represents “number” of all motor vehicle-related contacts
               **Race/Ethnicity is defined by HB 3051.
                **Not Required Racial/Ethnic Components
   85   86   87   88   89   90   91   92   93   94   95