Page 31 - NobleCon19revC2_Neat
P. 31

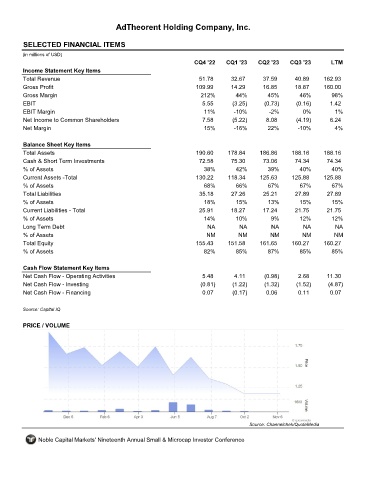
AdTheorent Holding Company, Inc.


       SELECTED FINANCIAL ITEMS                                ADTH

      (in millions of USD)
                                                                  CQ4 '22    CQ1 '23    CQ2 '23    CQ3 '23        LTM
       Income Statement Key Items
       Total Revenue                                                51.78      32.67      37.59      40.89     162.93
       Gross Profit                                                109.99      14.29      16.85      18.87     160.00
       Gross Margin                                                 212%         44%        45%        46%        98%
       EBIT                                                          5.55      (3.25)      (0.73)     (0.16)     1.42
       EBIT Margin                                                    11%       -10%        -2%         0%         1%
       Net Income to Common Shareholders                             7.58      (5.22)      8.08       (4.19)     6.24
       Net Margin                                                     15%       -16%        22%       -10%         4%


       Balance Sheet Key Items
       Total Assets                                                190.60     178.84     186.86     188.16     188.16
       Cash & Short Term Investments                                72.58      75.30      73.06      74.34      74.34
       % of Assets                                                    38%        42%        39%        40%        40%
       Current Assets -Total                                       130.22     118.34     125.63     125.88     125.88
       % of Assets                                                    68%        66%        67%        67%        67%
       Total Liabilities                                            35.18      27.26      25.21      27.89      27.89
       % of Assets                                                    18%        15%        13%        15%        15%
       Current Liabilities - Total                                  25.91      18.27      17.24      21.75      21.75
       % of Assets                                                   14%         10%         9%        12%        12%
       Long Term Debt                                                  NA         NA         NA         NA         NA
       % of Assets                                                    NM          NM         NM         NM         NM
       Total Equity                                                155.43     151.58     161.65     160.27     160.27
       % of Assets                                                    82%        85%        87%        85%        85%


       Cash Flow Statement Key Items
       Net Cash Flow - Operating Activities                          5.48       4.11       (0.98)     2.68      11.30
       Net Cash Flow - Investing                                    (0.81)     (1.22)      (1.32)     (1.52)     (4.87)
       Net Cash Flow - Financing                                     0.07      (0.17)      0.06       0.11       0.07


      Source: Capital IQ

       PRICE / VOLUME


                                                                                     Source: Channelchek/QuoteMedia

            Noble Capital Markets' Nineteenth Annual Small & Microcap Investor Conference
   26   27   28   29   30   31   32   33   34   35   36