Page 81 - NobleCon19revC2_Neat
P. 81

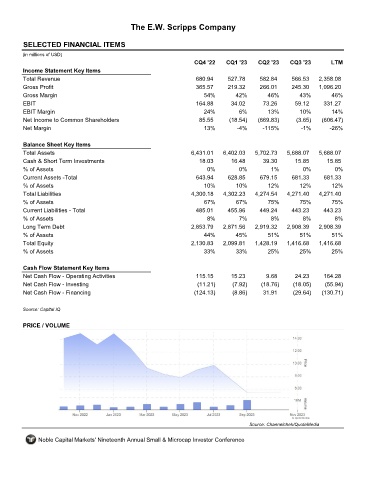
The E.W. Scripps Company


       SELECTED FINANCIAL ITEMS                                SSP

      (in millions of USD)
                                                                  CQ4 '22    CQ1 '23    CQ2 '23    CQ3 '23        LTM
       Income Statement Key Items
       Total Revenue                                               680.94     527.78     582.84     566.53    2,358.08
       Gross Profit                                                365.57     219.32     266.01     245.30    1,096.20
       Gross Margin                                                  54%         42%        46%        43%        46%
       EBIT                                                        164.88      34.02      73.26      59.12     331.27
       EBIT Margin                                                    24%         6%        13%        10%        14%
       Net Income to Common Shareholders                            85.55     (18.54)   (669.83)      (3.65)   (606.47)
       Net Margin                                                     13%        -4%      -115%        -1%       -26%


       Balance Sheet Key Items
       Total Assets                                              6,431.01   6,402.03   5,702.73   5,688.07    5,688.07
       Cash & Short Term Investments                                18.03      16.48      39.30      15.85      15.85
       % of Assets                                                     0%         0%         1%         0%         0%
       Current Assets -Total                                       643.94     628.85     679.15     681.33     681.33
       % of Assets                                                    10%        10%        12%        12%        12%
       Total Liabilities                                         4,300.18   4,302.23   4,274.54   4,271.40    4,271.40
       % of Assets                                                    67%        67%        75%        75%        75%
       Current Liabilities - Total                                 485.01     455.96     449.24     443.23     443.23
       % of Assets                                                     8%         7%         8%         8%         8%
       Long Term Debt                                            2,853.79   2,871.56   2,919.32   2,908.39    2,908.39
       % of Assets                                                   44%         45%        51%        51%        51%
       Total Equity                                              2,130.83   2,099.81   1,428.19   1,416.68    1,416.68
       % of Assets                                                    33%        33%        25%        25%        25%


       Cash Flow Statement Key Items
       Net Cash Flow - Operating Activities                        115.15      15.23       9.68      24.23     164.28
       Net Cash Flow - Investing                                   (11.21)     (7.92)    (18.76)     (18.05)    (55.94)
       Net Cash Flow - Financing                                  (124.13)     (8.86)     31.91      (29.64)   (130.71)


      Source: Capital IQ

       PRICE / VOLUME


                                                                                     Source: Channelchek/QuoteMedia

            Noble Capital Markets' Nineteenth Annual Small & Microcap Investor Conference
   76   77   78   79   80   81   82   83   84   85   86