Page 87 - NobleCon19revC2_Neat
P. 87

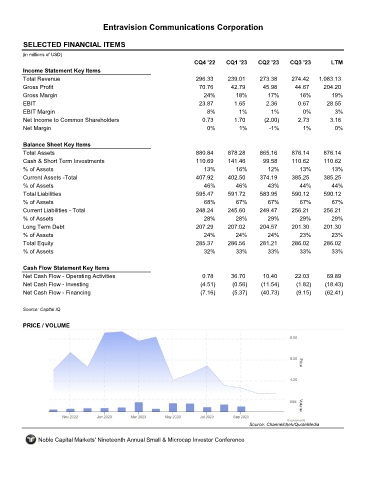
Entravision Communications Corporation


       SELECTED FINANCIAL ITEMS                                EVC

      (in millions of USD)
                                                                  CQ4 '22    CQ1 '23    CQ2 '23    CQ3 '23        LTM
       Income Statement Key Items
       Total Revenue                                               296.33     239.01     273.38     274.42    1,083.13
       Gross Profit                                                 70.76      42.79      45.98      44.67     204.20
       Gross Margin                                                  24%         18%        17%        16%        19%
       EBIT                                                         23.87       1.65       2.36       0.67      28.55
       EBIT Margin                                                     8%         1%         1%         0%         3%
       Net Income to Common Shareholders                             0.73       1.70       (2.00)     2.73       3.16
       Net Margin                                                      0%         1%        -1%         1%         0%


       Balance Sheet Key Items
       Total Assets                                                880.84     878.28     865.16     876.14     876.14
       Cash & Short Term Investments                               110.69     141.46      99.58     110.62     110.62
       % of Assets                                                    13%        16%        12%        13%        13%
       Current Assets -Total                                       407.92     402.50     374.19     385.25     385.25
       % of Assets                                                    46%        46%        43%        44%        44%
       Total Liabilities                                           595.47     591.72     583.95     590.12     590.12
       % of Assets                                                    68%        67%        67%        67%        67%
       Current Liabilities - Total                                 248.24     245.60     249.47     256.21     256.21
       % of Assets                                                   28%         28%        29%        29%        29%
       Long Term Debt                                              207.29     207.02     204.57     201.30     201.30
       % of Assets                                                   24%         24%        24%        23%        23%
       Total Equity                                                285.37     286.56     281.21     286.02     286.02
       % of Assets                                                    32%        33%        33%        33%        33%


       Cash Flow Statement Key Items
       Net Cash Flow - Operating Activities                          0.78      36.70      10.40      22.03      69.89
       Net Cash Flow - Investing                                    (4.51)     (0.56)    (11.54)      (1.82)    (18.43)
       Net Cash Flow - Financing                                    (7.16)     (5.37)    (40.73)      (9.15)    (62.41)


      Source: Capital IQ

       PRICE / VOLUME


                                                                                     Source: Channelchek/QuoteMedia

            Noble Capital Markets' Nineteenth Annual Small & Microcap Investor Conference
   82   83   84   85   86   87   88   89   90   91   92