
Page 93 - NobleCon19revC2_Neat
P. 93
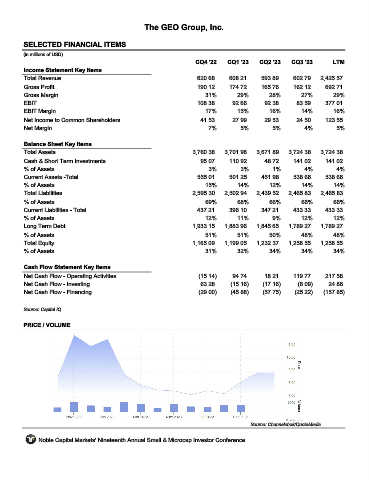
The GEO Group, Inc.


       SELECTED FINANCIAL ITEMS                                GEO

      (in millions of USD)
                                                                  CQ4 '22    CQ1 '23    CQ2 '23    CQ3 '23        LTM
       Income Statement Key Items
       Total Revenue                                               620.68     608.21     593.89     602.79    2,425.57
       Gross Profit                                                190.12     174.72     165.76     162.12     692.71
       Gross Margin                                                  31%         29%        28%        27%        29%
       EBIT                                                        108.38      92.66      92.38      83.59     377.01
       EBIT Margin                                                    17%        15%        16%        14%        16%
       Net Income to Common Shareholders                            41.53      27.99      29.53      24.50     123.55
       Net Margin                                                      7%         5%         5%         4%         5%


       Balance Sheet Key Items
       Total Assets                                              3,760.38   3,701.98   3,671.89   3,724.38    3,724.38
       Cash & Short Term Investments                                95.07     110.92      48.72     141.02     141.02
       % of Assets                                                     3%         3%         1%         4%         4%
       Current Assets -Total                                       555.01     501.25     451.98     538.66     538.66
       % of Assets                                                    15%        14%        12%        14%        14%
       Total Liabilities                                         2,595.30   2,502.94   2,439.52   2,465.83    2,465.83
       % of Assets                                                    69%        68%        66%        66%        66%
       Current Liabilities - Total                                 437.21     396.10     347.21     433.33     433.33
       % of Assets                                                   12%         11%         9%        12%        12%
       Long Term Debt                                            1,933.15   1,883.96   1,845.65   1,789.27    1,789.27
       % of Assets                                                   51%         51%        50%        48%        48%
       Total Equity                                              1,165.09   1,199.05   1,232.37   1,258.55    1,258.55
       % of Assets                                                    31%        32%        34%        34%        34%


       Cash Flow Statement Key Items
       Net Cash Flow - Operating Activities                        (15.14)     94.74      18.21     119.77     217.58
       Net Cash Flow - Investing                                    63.28     (15.16)    (17.16)      (6.09)    24.86
       Net Cash Flow - Financing                                   (29.00)    (45.88)    (57.75)     (25.22)   (157.85)


      Source: Capital IQ

       PRICE / VOLUME


                                                                                     Source: Channelchek/QuoteMedia

            Noble Capital Markets' Nineteenth Annual Small & Microcap Investor Conference