
Page 81 - NobleCon21
P. 81
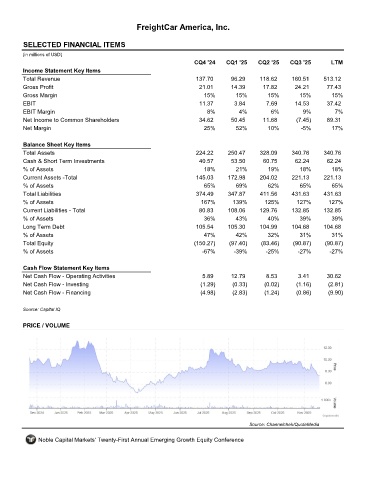
FreightCar America, Inc.


         SELECTED FINANCIAL ITEMS                                 RAIL
         (in millions of USD)
                                                                     CQ4 '24    CQ1 '25    CQ2 '25    CQ3 '25       LTM
         Income Statement Key Items
         Total Revenue                                               137.70      96.29     118.62      160.51     513.12
         Gross Profit                                                 21.01      14.39       17.82      24.21      77.43
         Gross Margin                                                   15%        15%        15%        15%        15%
         EBIT                                                         11.37        3.84       7.69      14.53      37.42
         EBIT Margin                                                     8%         4%         6%         9%          7%
         Net Income to Common Shareholders                            34.62      50.45       11.68      (7.45)     89.31
         Net Margin                                                     25%        52%        10%         -5%        17%

         Balance Sheet Key Items
         Total Assets                                                224.22     250.47     328.09      340.76     340.76
         Cash & Short Term Investments                                40.57      53.50       60.75      62.24      62.24
         % of Assets                                                    18%        21%        19%        18%         18%
         Current Assets -Total                                       145.03     172.98      204.02     221.13     221.13
         % of Assets                                                    65%        69%        62%        65%         65%
         Total Liabilities                                           374.49     347.87      411.56     431.63     431.63
         % of Assets                                                   167%       139%       125%       127%       127%
         Current Liabilities - Total                                  80.83     108.06     129.76      132.85     132.85
         % of Assets                                                    36%        43%        40%        39%        39%
         Long Term Debt                                              105.54     105.30     104.99      104.68     104.68
         % of Assets                                                    47%        42%        32%        31%        31%
         Total Equity                                                (150.27)    (97.40)    (83.46)    (90.87)    (90.87)
         % of Assets                                                   -67%       -39%        -25%       -27%       -27%

         Cash Flow Statement Key Items
         Net Cash Flow - Operating Activities                          5.89      12.79        8.53       3.41      30.62
         Net Cash Flow - Investing                                     (1.29)     (0.33)     (0.02)     (1.16)     (2.81)
         Net Cash Flow - Financing                                     (4.98)     (2.83)     (1.24)     (0.86)     (9.90)

         Source: Capital IQ


         PRICE / VOLUME


                                                                                        Source: Channelchek/QuoteMedia

              Noble Capital Markets' Twenty-First Annual Emerging Growth Equity Conference