
Page 20 - 2025 Housing Forecast
P. 20
20
2025 HOUSING FORECAST
National
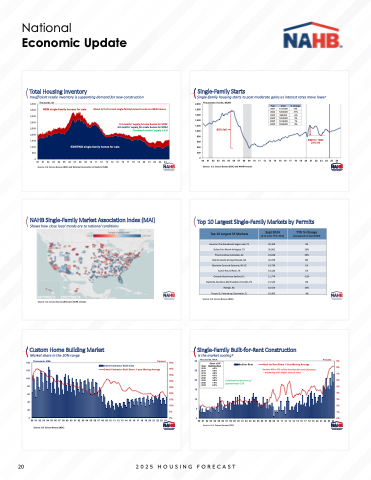
Economic Update
Total Housing Inventory
Insufficient resale inventory is supporting demand for new construction
Single-Family Starts
Single-family housing starts to post moderate gains as interest rates move lower
4,500 4,000 3,500 3,000 2,500 2,000 1,500 1,000
500 0
Thousands, SA
NEW single-family houses for sale
About 1/3 of current single-family homes for sale are NEW homes
9.5 months’ supply for new homes Oct 2024
4.0 months’ supply for resale homes Oct 2024
Combined months’ supply is 4.8
2,000 1,800 1,600 1,400 1,200 1,000
800 600 400 200
Thousands of units, SAAR
80% fall
Year 2021 2022 2023 2024f 2025f 2026f
Units 1,131,000 1,006,000 949,000 1,000,000 1,014,000 1,090,000
% Change 13% -11% -6% 5% 1% 8%
EXISTING single-family homes for sale
00 01 02 03 04 05 06 07 08 09 10 11 12 13 14 15 16 17 18 19 20 21 22 23 24
Source: U.S. Census Bureau (BOC) and National Association of Realtors (NAR)
0
00 01 02 03 04 05 06 07 08 09 10 11 12 13 14 15 16 17 18 19 20 21 22 23 24 25 26
NAHB Single-Family Market Association Index (MAI) Shows how close local trends are to national conditions
Source: U.S. Census Bureau (BOC) and NAHB analysis.
Custom Home Building Market Market share in the 20% range
Source: U.S. Census Bureau (BOC) and NAHB forecast
Top 10 Largest Single-Family Markets by Permits
90 91 92 93 94 95 96 97 98 99 00 01 02 03 04 05 06 07 08 09 10 11 12 13 14 15 16 17 18 19 20 21 22 23 24
Source: U.S. Census Bureau (BOC)
90
91 92 93 94 95 96 97 98 99 00 01 02 03 04 05 06 07 08 09 10 11 12 13 14 15 16 17 18 19 20 21 22 23 24
Source: U.S. Census Bureau (BOC)
5
6% 5% 4% 3% 2% 1% 0%
Top 10 Largest SF Markets
Houston-The Woodlands-Sugar Land, TX Dallas-Fort Worth-Arlington, TX Phoenix-Mesa-Scottsdale, AZ Atlanta-Sandy Springs-Roswell, GA Charlotte-Concord-Gastonia, NC-SC Austin-Round Rock, TX Orlando-Kissimmee-Sanford, FL Nashville-Davidson-Murfreesboro-Franklin, TN Raleigh, NC
Tampa-St. Petersburg-Clearwater, FL
Source: U.S. Census Bureau (BOC).
Sept 2024
(# of units YTD, NSA)
40,109 36,961 23,648 20,239 14,739 13,120 11,774 11,543 10,554 10,463
YTD % Change (compared to Sept 2023)
3% 15% 30% 8% 1% 1% -12% 4% 10% -4%
4Q20 to 1Q23 32% fall
140 120 100 80 60 40 20
0
Thousands, NSA
Percent 45% Owner/Contractor Built Share: 1-year Moving Average 40%
30 25 20 15 10
Single-Family Built-for-Rent Construction Is the market cooling?
Thousands, NSA
Percent 9% 8%
Owner/Contractor Built Units
Share of SF Year Built for Rent
2016 4.3%
2017 4.4%
2018 4.8%
2019 4.3%
2020 4.5%
2021 4.6%
2022 7.0%
2023 8.2%
Built for Rent
Combined market share of approximately 12%
Built for Rent Share 1-Year Moving Average
35%
30%
25%
20%
15%
10%
5% 0%0
Another 4% to 5% sold to investors for rental purposes
– weakening with higher interest rates 7%
