
Page 20 - Builder Brief June 2026 Issue
P. 20
R E M O D E L I N G
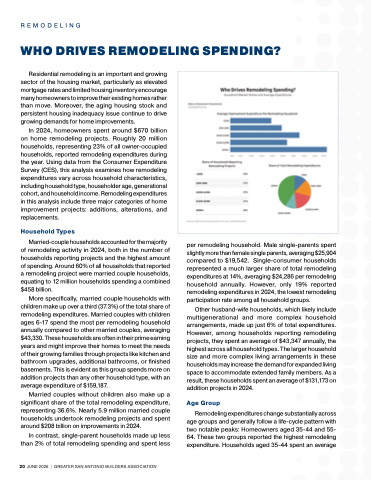
WHO DRIVES REMODELING SPENDING?
Residential remodeling is an important and growing
sector of the housing market, particularly as elevated
mortgage rates and limited housing inventory encourage
many homeowners to improve their existing homes rather
than move. Moreover, the aging housing stock and
persistent housing inadequacy issue continue to drive
growing demands for home improvements.
In 2024, homeowners spent around $670 billion
on home remodeling projects. Roughly 20 million
households, representing 23% of all owner-occupied
households, reported remodeling expenditures during
the year. Using data from the Consumer Expenditure
Survey (CES), this analysis examines how remodeling
expenditures vary across household characteristics,
including household type, householder age, generational
cohort, and household income. Remodeling expenditures
in this analysis include three major categories of home
improvement projects: additions, alterations, and
replacements.
Household Types
Married-couple households accounted for the majority
of remodeling activity in 2024, both in the number of
households reporting projects and the highest amount
of spending. Around 60% of all households that reported
a remodeling project were married couple households,
equating to 12 million households spending a combined
$458 billion.
More specifically, married couple households with
children make up over a third (37.3%) of the total share of
remodeling expenditures. Married couples with children
ages 6-17 spend the most per remodeling household
annually compared to other married couples, averaging
$43,330. These households are often in their prime earning
years and might improve their homes to meet the needs
of their growing families through projects like kitchen and
bathroom upgrades, additional bathrooms, or finished
basements. This is evident as this group spends more on
addition projects than any other household type, with an
average expenditure of $159,187.
Married couples without children also make up a
significant share of the total remodeling expenditure,
representing 36.6%. Nearly 5.9 million married couple
households undertook remodeling projects and spent
around $208 billion on improvements in 2024.
In contrast, single-parent households made up less
than 2% of total remodeling spending and spent less
per remodeling household. Male single-parents spent
slightly more than female single parents, averaging $25,904
compared to $19,542. Single-consumer households
represented a much larger share of total remodeling
expenditures at 14%, averaging $24,286 per remodeling
household annually. However, only 19% reported
remodeling expenditures in 2024, the lowest remodeling
participation rate among all household groups.
Other husband-wife households, which likely include
multigenerational and more complex household
arrangements, made up just 6% of total expenditures.
However, among households reporting remodeling
projects, they spent an average of $43,347 annually, the
highest across all household types. The larger household
size and more complex living arrangements in these
households may increase the demand for expanded living
space to accommodate extended family members. As a
result, these households spent an average of $131,173 on
addition projects in 2024.
Age Group
Remodeling expenditures change substantially across
age groups and generally follow a life-cycle pattern with
two notable peaks: Homeowners aged 35-44 and 55-
64. These two groups reported the highest remodeling
expenditure. Households aged 35-44 spent an average
20 JUNE 2026 | GREATER SAN ANTONIO BUILDERS ASSOCIATION
