
Page 21 - Builder Brief June 2026 Issue
P. 21
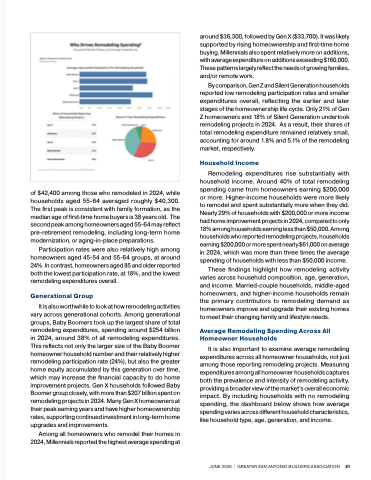
of $42,400 among those who remodeled in 2024, while
households aged 55-64 averaged roughly $40,300.
The first peak is consistent with family formation, as the
median age of first-time home buyers is 38 years old. The
second peak among homeowners aged 55-64 may reflect
pre-retirement remodeling, including long-term home
modernization, or aging-in-place preparations.
Participation rates were also relatively high among
homeowners aged 45-54 and 55-64 groups, at around
24%. In contrast, homeowners aged 85 and older reported
both the lowest participation rate, at 18%, and the lowest
remodeling expenditures overall.
Generational Group
It is also worthwhile to look at how remodeling activities
vary across generational cohorts. Among generational
groups, Baby Boomers took up the largest share of total
remodeling expenditures, spending around $254 billion
in 2024, around 38% of all remodeling expenditures.
This reflects not only the larger size of the Baby Boomer
homeowner household number and their relatively higher
remodeling participation rate (24%), but also the greater
home equity accumulated by this generation over time,
which may increase the financial capacity to do home
improvement projects. Gen X households followed Baby
Boomer group closely, with more than $207 billion spent on
remodeling projects in 2024. Many Gen X homeowners at
their peak earning years and have higher homeownership
rates, supporting continued investment in long-term home
upgrades and improvements.
Among all homeowners who remodel their homes in
2024, Millennials reported the highest average spending at
around $36,300, followed by Gen X ($33,700). It was likely
supported by rising homeownership and first-time home
buying. Millennials also spent relatively more on additions,
with average expenditure on additions exceeding $160,000.
These patterns largely reflect the needs of growing families,
and/or remote work.
By comparison, Gen Z and Silent Generation households
reported low remodeling participation rates and smaller
expenditures overall, reflecting the earlier and later
stages of the homeownership life cycle. Only 21% of Gen
Z homeowners and 18% of Silent Generation undertook
remodeling projects in 2024. As a result, their shares of
total remodeling expenditure remained relatively small,
accounting for around 1.8% and 5.1% of the remodeling
market, respectively.
Household Income
Remodeling expenditures rise substantially with
household income. Around 40% of total remodeling
spending came from homeowners earning $200,000
or more. Higher-income households were more likely
to remodel and spent substantially more when they did.
Nearly 29% of households with $200,000 or more income
had home improvement projects in 2024, compared to only
18% among households earning less than $50,000. Among
households who reported remodeling projects, households
earning $200,000 or more spent nearly $61,000 on average
in 2024, which was more than three times the average
spending of households with less than $50,000 income.
These findings highlight how remodeling activity
varies across household composition, age, generation,
and income. Married-couple households, middle-aged
homeowners, and higher-income households remain
the primary contributors to remodeling demand as
homeowners improve and upgrade their existing homes
to meet their changing family and lifestyle needs.
Average Remodeling Spending Across All
Homeowner Households
It is also important to examine average remodeling
expenditures across all homeowner households, not just
among those reporting remodeling projects. Measuring
expenditures among all homeowner households captures
both the prevalence and intensity of remodeling activity,
providing a broader view of the market’s overall economic
impact. By including households with no remodeling
spending, the dashboard below shows how average
spending varies across different household characteristics,
like household type, age, generation, and income.
JUNE 2026 | GREATER SAN ANTONIO BUILDERS ASSOCIATION 21
