
Page 15 - PFAR Report 2022
P. 15
Brevard Orange Miami-Dade
$ $ 833 059 475 65 828 $1 $ $ 2
2
2
2
642 541 171 206 058 $1 How Funds Are Spent
$ 4 4 4 354 450 000
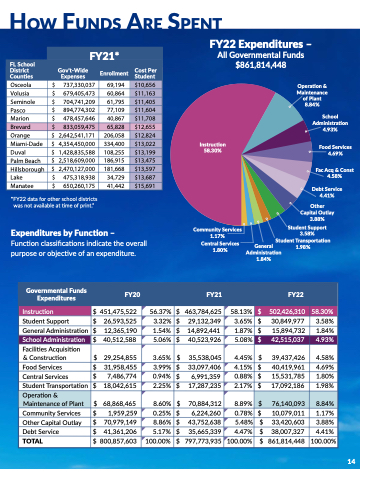
334 400 $1 $1 $1 $1 $1 $1 $ $ $ $ Expendituresobf PylaFnut nction nction – Maintenance
Function classifications indicate the overall
General Administration 1 84%
or the the Other
School
Energy Services $ Community Services 1 1 17%
Central Services 1 80%
Capital Outlay $ 2
2
541 535 0 42%
1 98%
purpose or objective of an expenditure $ 13 834 471 2
30%
Administration TOTAL $ 602 710 375 100 00% 4 93%
FY22 Expenditures – Duval $ 1 428 835 588
108 255 186 915 181 668 34 729 41 442
Palm Beach $ 2
518 609 000
All Governmental Funds Hillsborough $ 2
2
470 127 000
Lake $ 475 318 938
$861 814 448
Manatee
$ 650 260 175
Osceola
Volusia
Seminole
Pasco
Marion Brevard Orange Duval Land
Construc
Improve
Furniture
Miami-Dade
Motor V AV Mate
Palm Beach Hillsborough Lake Manatee
Genera $ 737 330 037
$ 679 405 473
$ 704 741 209
$ 894 774 302
tion in Progress
$ 478 457 646 ents
Other
Than
$ 833 059 475 $ 2
2
642 541 171 Fixtures and Eq
$ 4 4 4 354 450 000
hicles
$ 1 428 835 588
rials and Compute
$ 2
518 609 000
TOTAL $ 2
2
470 127 000
$ 475 318 938
$ 650 260 175
l Fund Expenditur FY21*
FL School
District Gov't-Wide Enrollment Cost Per Counties Expenses Student
69 194
60 864
61 795
77 109
40 867 Buildings
65 828 206 058 uipment
334 400 108 255 r
r
Software
186 915 181 668 34 729 41 442
es by Obje
$10 656
$11 163
$11 405 $11 604
$11 708
$12 655
$12 824
$13 022
$13 199
$13 475 $13 597
$13 687
$15 691
ct FY22 $ $ $ $ $ $ $ FY22 Capital Assets
m Buildings
and Fixed Equipment
36 305 622 59 005 037
12
948 786
666 353 058 13 951 499
Operation & Maintenance
of Plant 8 8 84%
e e e $ School
Administration 4 93%
Food Services 4 69%
Fac Acq & Const 4 58%
Instruction 14 14 134 14758 30%
was not available at at time of print ”
109
399 318 100 634 787
15 143 480
18 15%
16 70% 2
51%
3 3 37%
Employee Benefits $ Purchased SOeprveircaetis on &$
Materials and Supplies $ 20 281 390 8 8 84%
*FY22 data for other school districts
Salaries $ $ $340 875 394 56 55%
213 931
802 912 080
Due in One Year
Debt Service 4 4 41%
Other
Capital Outlay 3 88%
Student
Support 3 58%
Student
Transportation
Governmental Funds Expenditures Food Services FY20 FY21 FY22 4 69%
Instruction $ 451 475 522
56 37%
$ 463 784 625
58 13%
$ 502 426 310 58 30%
Student
Support FacA
cq & Const $ 26 593 525
3 3 32%
$ 29 132 349
3 65%
$ 30 849 977
3 58%
General Administration $ 12
365 190
1 54%
$ 14 892 441
1 87%
$ 15 894 732
1 84%
School
Administration Debt S $ 40 512 588
ervice 5 06%
$ 40 523 926
5 08%
$ 42 515 037
4 93%
Facilities Acquisition4 4 4 & Construction
1%
$ 29 254 855
3 65%
$ 35 538 045
4 4 45%
$ 39 437 426 4 58%
Food Services Capital Outl $ 31 958 455
ay 3 99%
$ 33 097 406
4 15%
$ 40 419 961
4 69%
Central Services3 88%
$ 7 7 7 486 774 0 94%
$ 6 991 359
0 88%
$ 15 531 785
1 80%
Student
Student
Transportation
Student
Student
Support $ 18 042 615
2
2
25%
$ 17 287 235
2
17%
$ 17 092 186 1 98%
Operation &3 58%
MSatiundtenatnTcreanosfpPolratnattio
n$ 68 68 868 465
8 60%
$ 70 884 312
8 8 89%
$ 76 140 093
8 8 84%
ral 1 98%
Community Services $ 1 959 259
0 25%
$ 6 6 224 260 0 78%
$ 10 079 011
1 1 17%
%Other Capital Outlay $ 70 979 149
8 8 86%
$ 43 752 638
5 48%
$ 33 420 603
3 88%
Debt Service $ 41 361 206 5 17%
$ 35 665 339
4 4 47%
$ 38 007 327
4 4 41%
TOTAL $ 800 857 603
100 00% $ 797 773 935
100 00% $ 861 814 448
100 00% 4 58%
Other
Gene 1 84 14 